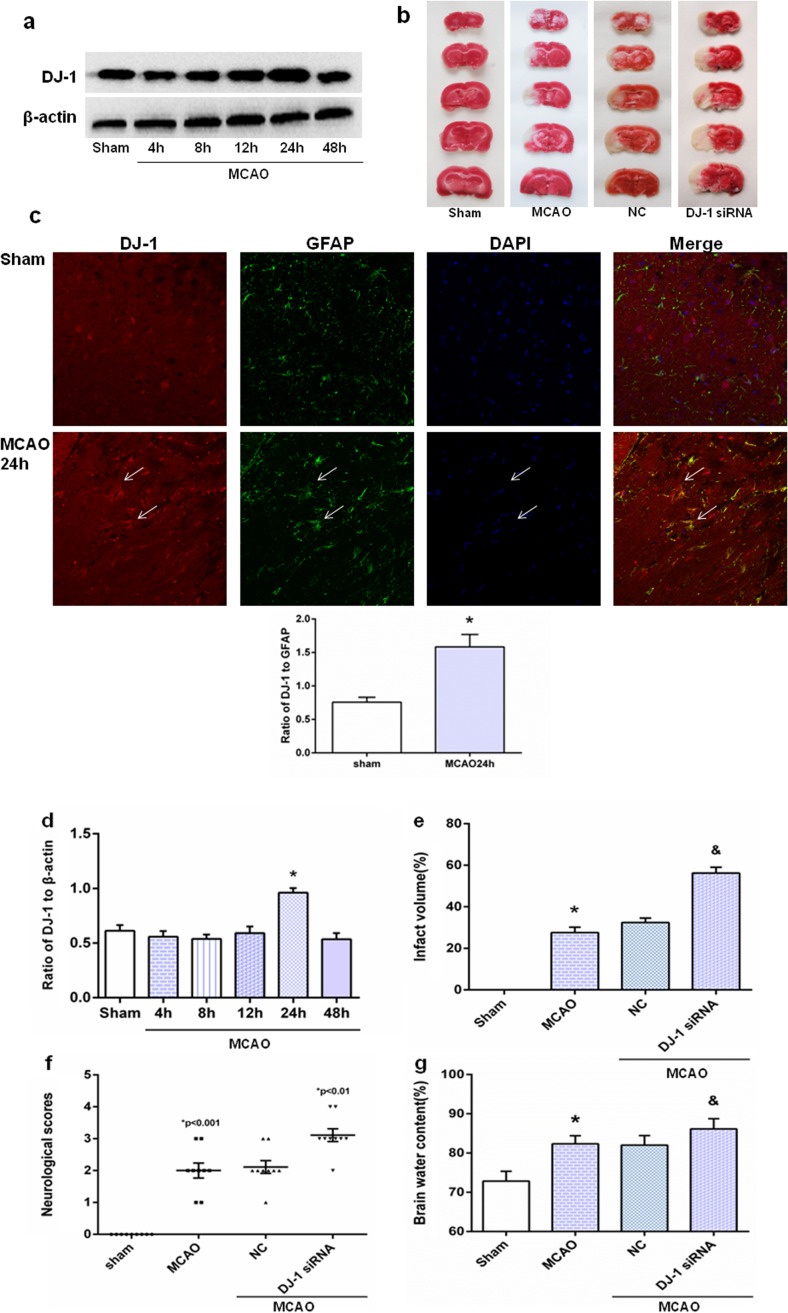
Fig. 2.
DJ-1 ameliorated cerebral (I/R) injury after MCAO/R. a Western blot of DJ-1. d Ratios of DJ-1 relative to β-actin. In the 24-h group, DJ-1 levels increased compared with the sham group. Values are mean ± SEM. *p < 0.05. n = 3 of samples/group from an experiment, three independent experiments were carried out. c Immunohistochemistry for DJ-1 and semi-quantitation to determine percentage of DJ-1-postive cells relative to GFAP-positive cells in astrocytes. In the 24-h MCAO group, DJ-1 was expressed at higher levels in reactive astrocytes in cortical infarct regions compared with controls. Laser scanning confocal microscope was used to assess expression. DJ-1 expression in astrocytes is indicated by red fluorescence. GFAP expression in astrocytes is indicated by green fluorescence. Cell nuclei were stained with DAPI. Original magnification, 400×. Values are expressed as mean ± SEM. *p < 0.05 vs. sham. n = 3 of samples/group from an experiment, three independent experiments were carried out. b, e Infarct volume of brain. f Neurological scores. g Brain water content. Infarct volume, neurological scores, brain water content were significantly increased in the DJ-1 siRNA group compared with the MCAO and NC groups. Values are mean ± SEM. *p < 0.01 vs. sham; &p < 0.05 vs. MCAO, n = 3 of samples/group from an experiment, three independent experiments were carried out

