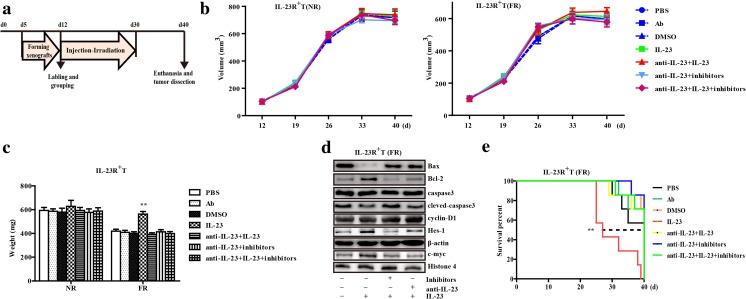
Fig. 4.
The in vivo study of IL-23 and radioresistance in a xenograft mouse model of ESCC. a Graphical representation of the experimental protocol and treatment schedule for stimulation and radiation in mice. b Line chart represents the average periodical tumor volume every week. The growth curves of CD133−IL-23R+TE-1 cell xenograft tumors receiving different treatments, including PBS, isotype Ab, DMSO vehicle, irradiation, anti-IL-23 (1 μg in 100 μL PBS), human recombinant IL-23 (50 ng in 100 μL PBS), and the composite inhibitors (DAPT, 20 μmol and ICG-001, 50 μmol dissolved with DMSO in 100 μL PBS per day). The tumor volume was calculated as described in the “Materials and methods” section. NR, no-irradiation treatment; FR, fractionated radiation. c Column chart of xenograft tumor weights after different treatments (PBS, anti-IL-23, IL-23, irradiation, and the inhibitors). The tumors were weighed after 40 days or death. d Immunoblot analysis of activated Wnt/Notch signaling and apoptosis-related proteins in homogenized xenograft lysates after radiotherapy. After 40 days, the survived mice were euthanized, and tumors were harvested from all groups to assess the effect of inhibitors. Representative data are shown. e Fractions of surviving animal in different groups (n = 7 per group). **p < 0.01

