
Fig. 1.
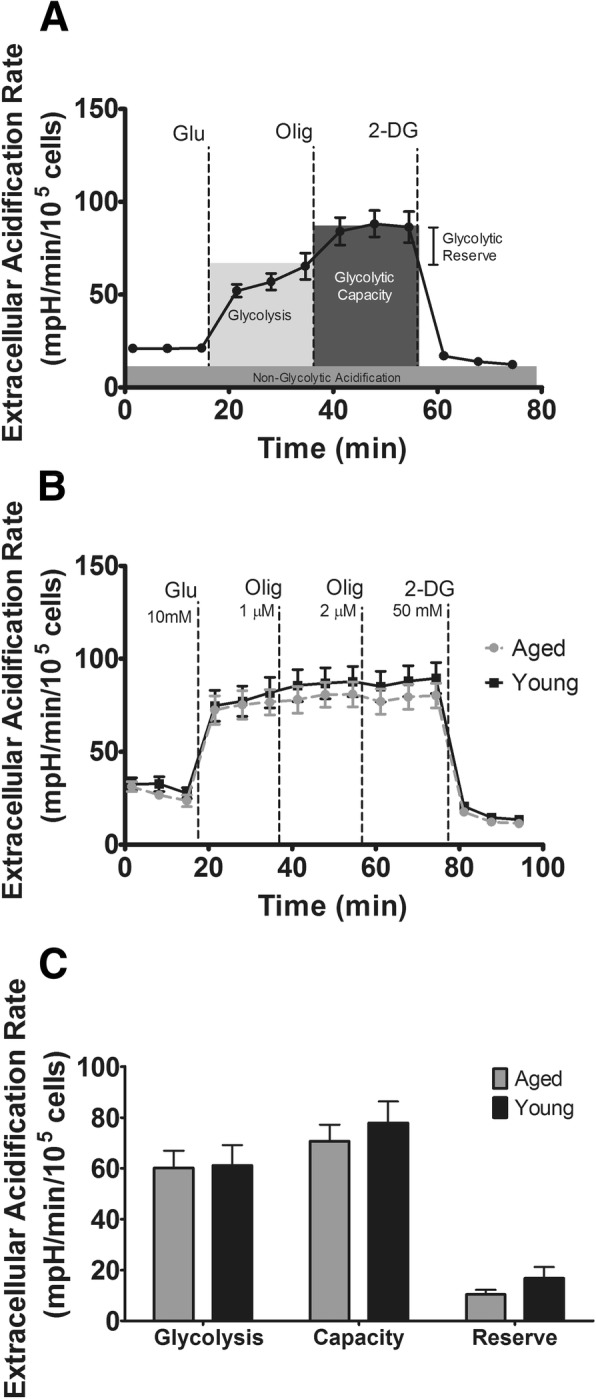
Glycolysis stress test. a Example glycolysis stress test assay showing calculated parameters. On the Y-axis, extracellular acidification rate is the mpH change over 1-min intervals, which is then expressed relative to 100,000 monocytes to account for between-well cell number variation. b Aged vs. young glycolysis stress test. c Calculated parameters of glycolysis stress test for aged and young subjects