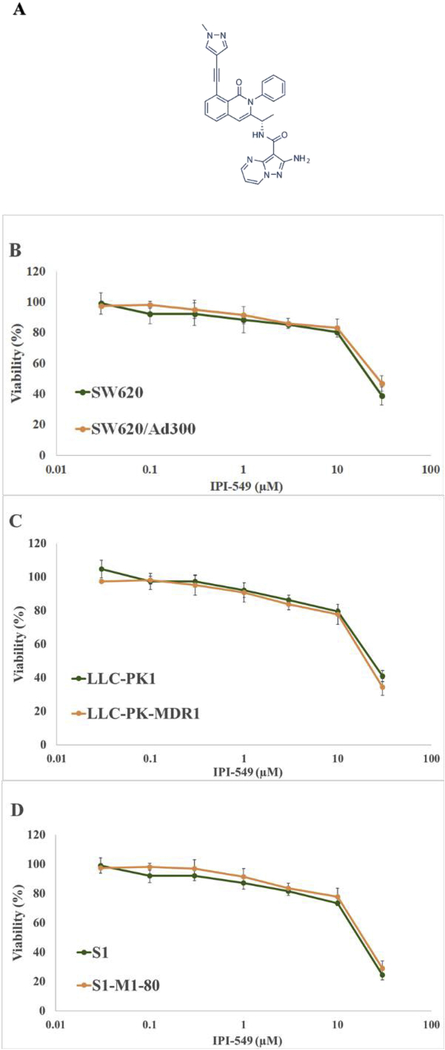
Figure 1. Chemical structure of IPI-549 and cytotoxicity of IPI-549 on parental and drugresistant cells.
Chemical structure of IPI-549 (A). Cell survival (%) percentage was measured after treatment with IPI-549 for 72 h on parental and drug-resistant cells: SW620 and SW620/AD300 cells (B), LLC-PK1 and LLC-PK-MDR1 cells (C), S1 and S1-M1–80 cells (D). Points with error bars represent the mean ± SD for independent determinations in triplicate. The above figures are representative of three independent experiments.

