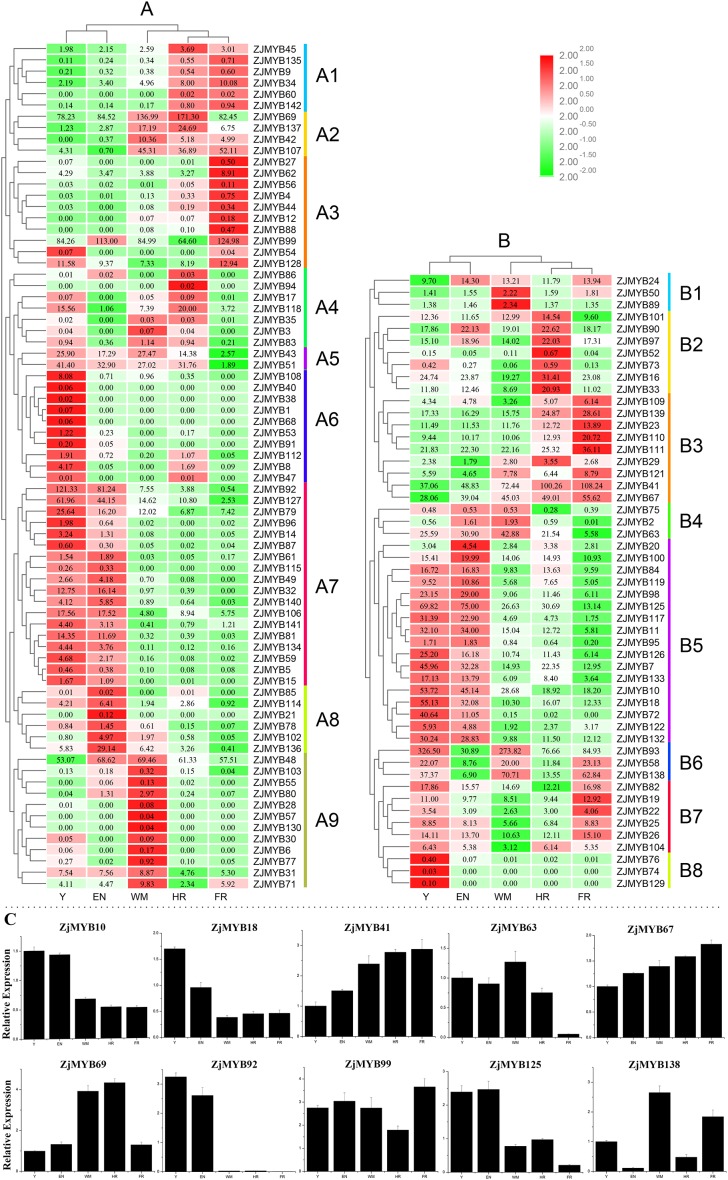
Figure 8. Heatmap of the expression levels of MYB genes in different developmental stages in jujube fruit and the expression levels of 10 ZjMYB genes by qRT-PCR.
Y, young stage; EN, enlargement stage; WM, white mature stage; HR, half-red stage; and FR, full-red stage. The color scale shown at the top represents log2-transformed FPKM (fragments per kilobase of exon per million mapped reads) counts. Original FPKM counts are displayed in the corresponding rectangles. Red indicates high expression and green indicates low expression. We eliminated the jujube MYB genes whose expression levels were zero in all stages. (A) Heatmap of the expression levels of 71 R2R3-MYB, three R1R2R3-MYB, and one 4R-MYB genes in different developmental stages in jujube fruit. (B) Heatmap of the expression levels of 44 MYB-related and seven atypical MYB genes in different developmental stages in jujube fruit. A1–A9 and B1–B8 indicate the different subgroups. (C) Expression analysis of 10 MYB genes in jujube by qRT-PCR. The data were normalized to the UBQ gene, and the vertical bars indicate the standard deviation.

