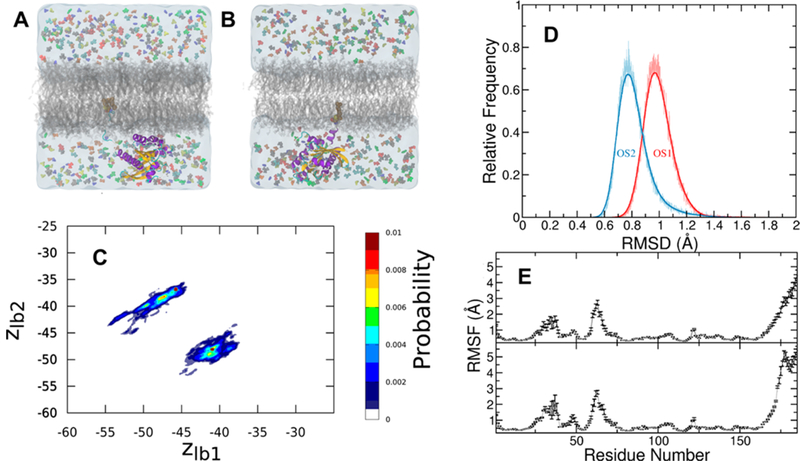
Figure 5.

Protein conformational dynamics in the presence of probes. (A, B) K-Ras in orientation state 1 (OS1) in which helices 3 and 4 are in contact with the bilayer surface (A) and orientation state 2 (OS2) in which the central β sheet β1−3 and helix 2 are in contact with the membrane (B). The protein is shown in cartoon colored in purple (helices), yellow (strands), and cyan/white (turns). Farnesyl in vdW spheres is inserted into the core of the bilayer (gray). Water is in transparent light blue shading, and the probes are in differently colored spheres. Sodium, magnesium, and chloride ions as well as GTP are omitted for clarity. (B) Membrane orientation dynamics of G12D K-Ras catalytic domain measured by the vertical distance of lobe 1 and lobe 2 from the bilayer center. (D) Distribution of ensemble-averaged backbone root-mean square deviation (RSMD) of the K-Ras catalytic domain from a combined trajectory of all simulations in OS1 (red) and OS2 (blue). (E) Backbone root-mean square fluctuations (RMSF) of G12D K-Ras in OS1 (bottom) and OS2 (top).
