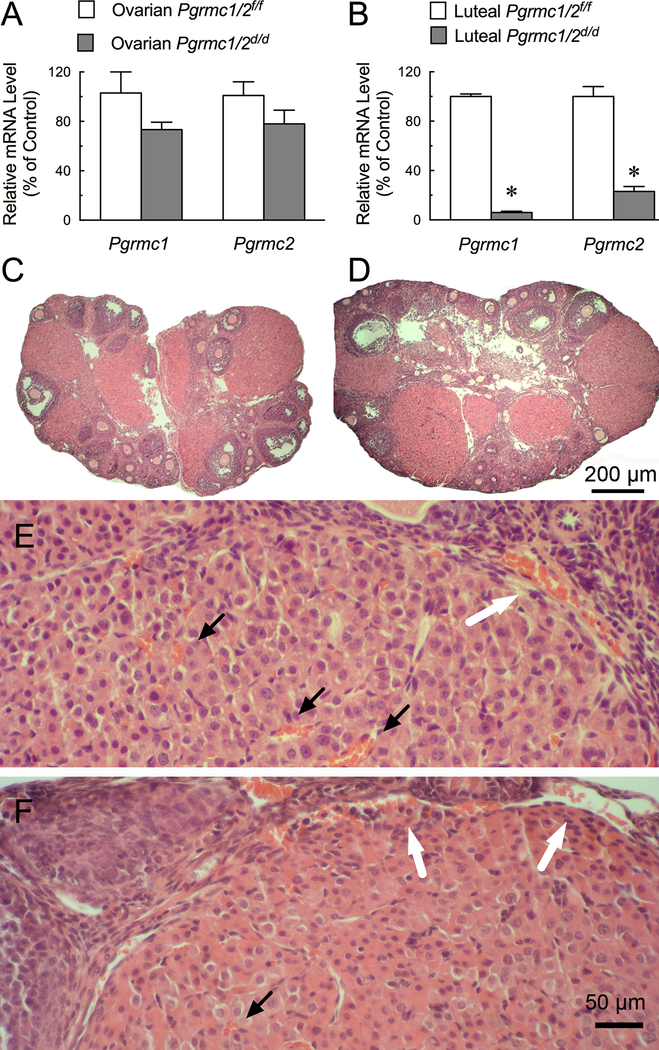
Figure 2.
The levels of Pgrmc1 and Pgrmc2 mRNA in the ovary (A) and CL (B) of Pgrmc1/2fl/fl and Pgrmc1/2 d/d mice on DOPP4. Ovarian morphology of control Pgrmc1/2fl/f (C,E) and Pgrmc1/2d/d (D,F) mice. Note the red blood cells (orange; marked by black arrows) among the luteal cells of controls (E) compared to Pgrmc1/2d/d knockout mice (F). Some red blood cells in vessels outside the CL are marked by white arrows in E and F.

