
Fig. 2.
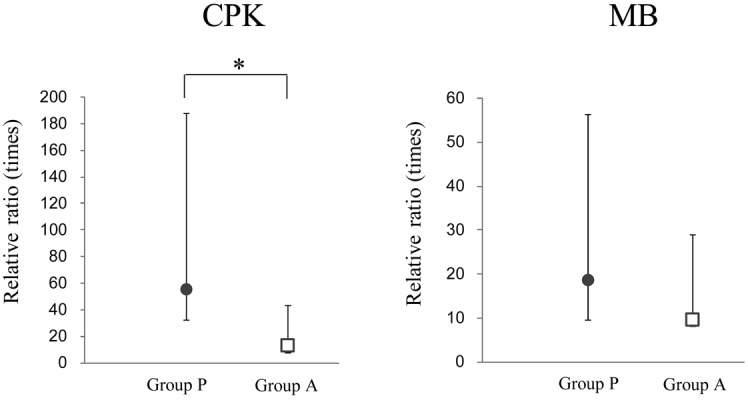
Mean ± 95% confidence interval (n=10) of the ratio of changes relative to pre-exercise load values (ratio=values at each point/values at Pre) for serum creatin phosphokinase (CPK) activity (left) and myoglobin concentration (MB) (right) on the days at which maximum concentrations were observed (days 5 and 3, respectively). Group P and Group A mean placebo group and LEAA group. *Significant difference between placebo and LEAA ingestion (p<0.05).