FIGURE 2.
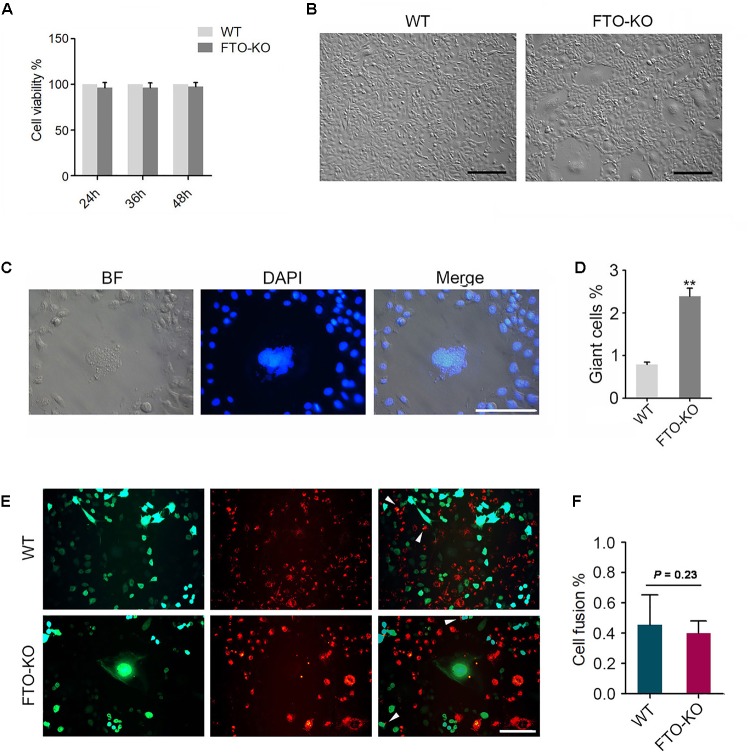
Phenotypes of FTO depletion in spermatogonia. (A) Effect of FTO depletion on cell viability. (B) Image of morphology of wild-type cells and FTO-KO cells. Bar = 100 μM. (C) Morphology of nuclei of giant cells and normal cells. (D) Percentage of giant cells were shown in column diagram. Data were represented by the mean ± SEM, n = 3, ∗∗p < 0.01. (E) Wild-type cells and FTO-KO cells were stained with red and green dye, respectively, and were co-cultured for 48 h. Representative image of cell fusion status. White arrows indicate the fused cells. Scale bar = 20 μm. (F) Percentage of cell fusion were shown in column diagram. Data were represented by the mean ± SEM, n = 3.

