FIGURE 5.
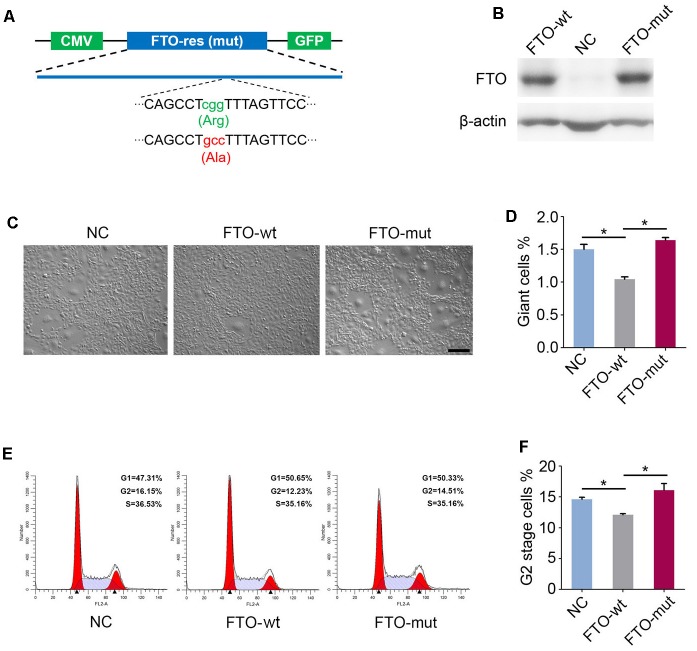
Fat mass and obesity-associated protein regulates giant cell formation and G2/M transition dependent on the m6A demethylase activity. (A) Schematic diagram of FTO-wt and FTO-mut plasmids. Green and red letters represent the mutation of 313R to A. (B) Western blot analysis of FTO expression in the FTO-wt cells and the FTO-mut cells. β-actin was used as the loading control. (C) Morphology of FTO-wt cells and FTO-mut cells. Bar = 100 μm. (D) Percentage of giant cells were shown in column diagram. Data were represented by the mean ± SEM, n = 3, ∗∗p < 0.01. (E) Cell cycle of FTO-wt and FTO-mut cells were analyzed by flow cytometry. (F) Percentage of G2 stage cells were shown in column diagram. Data were represented by the mean ± SEM, n = 3, ∗p < 0.05.

