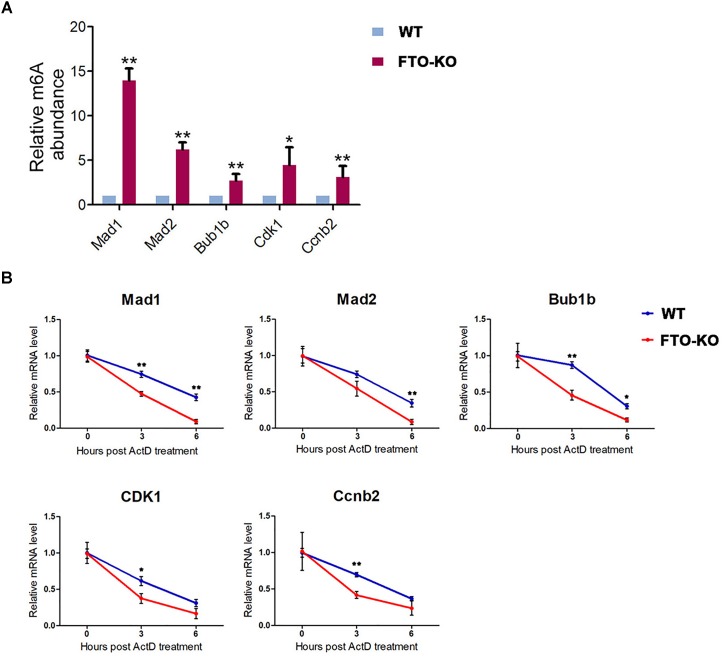
FIGURE 6.
Fat mass and obesity-associated protein targets the m6A modification on the key components of MCC and G2/M regulators. (A) mRNA isolated from wild-type cells and FTO-KO cells were subjected to m6A-IP. The m6A positive mRNA were detected via quantitative PCR. Y axes represent the relative mRNA level in IP-mRNA compared to input. Data were represented by the mean ± SEM, n = 3, ∗p < 0.05, ∗∗p < 0.01. (B) Cells were treated with 5 μg/mL actinomycin and harvested for RNA extraction. Target mRNA level were quantitated by q-PCR. X axes represent hours post treatment. Y axes represent the remained mRNA level. Data were represented by the mean ± SEM, n = 3, ∗p < 0.05, ∗∗p < 0.01.

