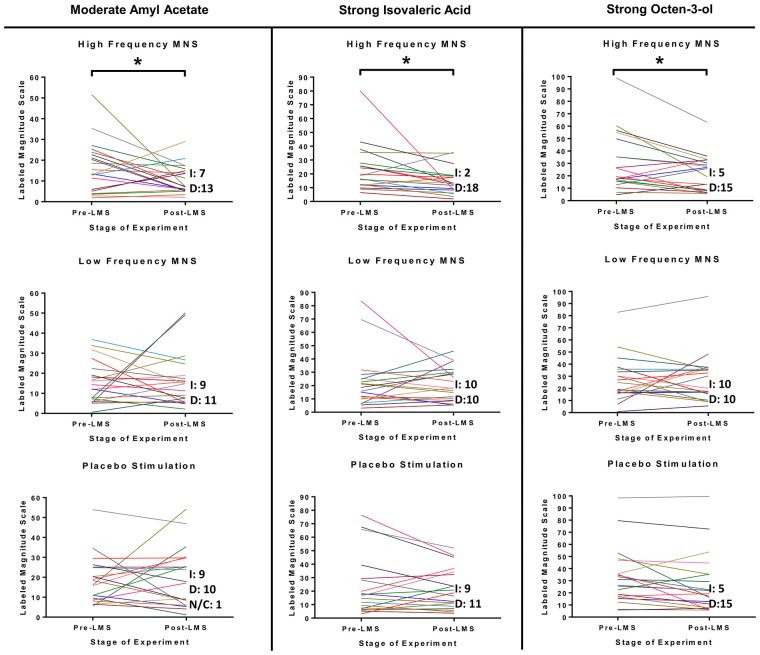
Figure 3.
LMS test results for moderate concentration of Amyl Acetate, strong concentration of Isovaleric Acid and strong concentration of 1-Octen-3-ol from each participant before and after each stimulation parameter (high frequency MNS, low frequency MNS and placebo). Each participant’s scores, before (Pre-S LMS) and after (Post-S LMS) each of the stimulation parameters (high frequency MNS, low frequency MNS and placebo), for the LMS (LMS scores range = 0–100). Each colored line represents one case (total cases = 20). Letter “I” corresponds to cases that increased LMS test score in Post-S LMS in comparison to Pre-S LMS, letter “D” corresponds to cases that decreased LMS test score in Post-S LMS in comparison to Pre-S LMS and letters “N/C” corresponds to no change in LMS test score in Post-S LMS in comparison to Pre-S LMS. *Statistically significant (p < 0.05).

