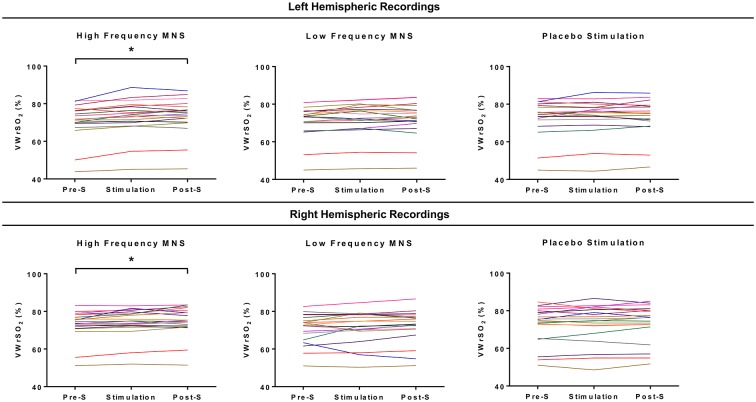
Figure 4.
Each of the participant’s recordings for all three stages of the experiment (pre-stimulation LMS, stimulation parameter, post-stimulation LMS) for each stimulation parameter (high frequency MNS, low frequency MNS and placebo) from both the left and right hemispheres of the OFCs, measuring venous oxygen reserve (VWrSO2%) using NIRS. Each colored line represents one case (total cases = 20). *Statistically significant (p < 0.05).

