
FIGURE 3.
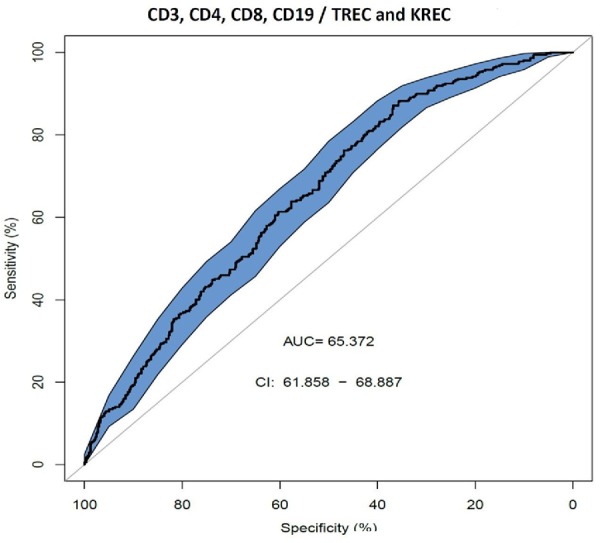
Receiver operating characteristic (ROC) curves for combination of TREC and KREC for the ability to predict abnormal values of lymphocyte subpopulations (CD3, CD4, CD8, and CD19), (n = 931).
Official websites use .gov
A
.gov website belongs to an official
government organization in the United States.
Secure .gov websites use HTTPS
A lock (
) or https:// means you've safely
connected to the .gov website. Share sensitive
information only on official, secure websites.
Receiver operating characteristic (ROC) curves for combination of TREC and KREC for the ability to predict abnormal values of lymphocyte subpopulations (CD3, CD4, CD8, and CD19), (n = 931).