FIGURE 2.
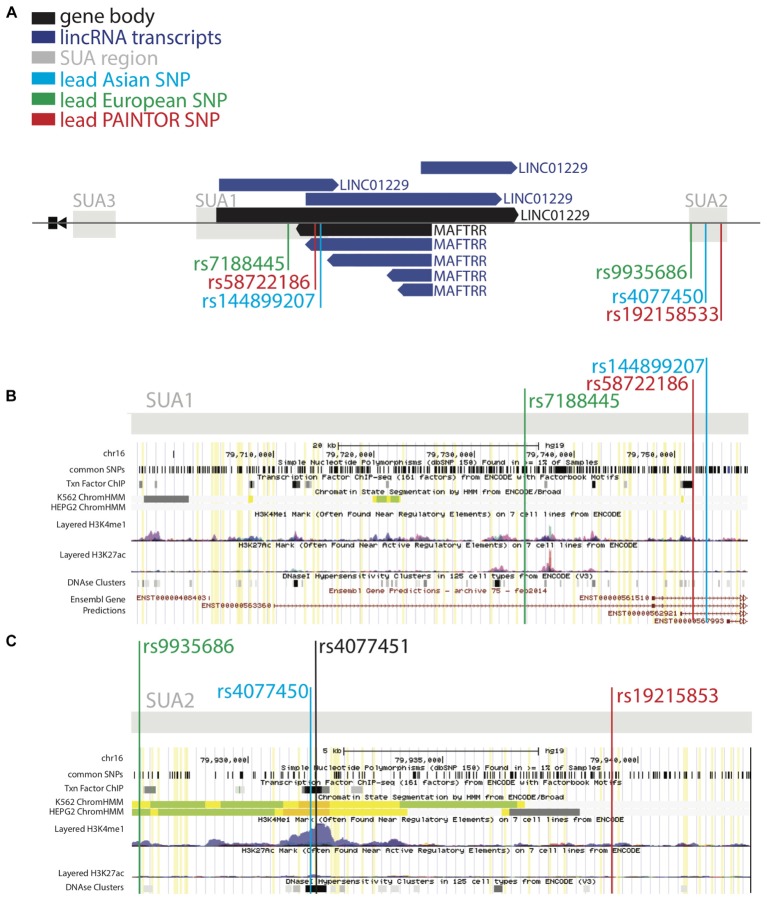
SUA2 has hallmarks of enhancer function. (A) The MAF upstream region marked by SUA variants in Köttgen et al. (2013) and Kanai et al. (2018). LincRNA gene bodies (black) and transcripts (dark blue) are depicted. (B,C) ENCODE screenshots of the SUA1 and SUA2 regions. The presence of enhancer elements; DNaseI hypersensitivity regions (DHS) (Thurman et al., 2012), H3K27ac and H3K4me1 chromatin modifications (Heintzman et al., 2009), transcription factor binding sites (Wang et al., 2012) and predicted ChromHMM enhancers (Ernst and Kellis, 2017) are shown. Yellow lines indicate Köttgen SUA variants (p < 10-5) (B) A schematic of the ENCODE annotation of the SUA1 region, which includes the lead SUA1 PAINTOR SNP rs58722186 (red) lead European urate SNP rs7188445 (green) and lead Japanese urate SNP rs144899207 (blue). (C) A schematic of the ENCODE annotation of the SUA2 region, which includes the lead SUA2 PAINTOR SNP rs192158533 (red) lead European urate SNP rs9935686 (green) and lead Japanese urate SNP rs4077450 (blue).

