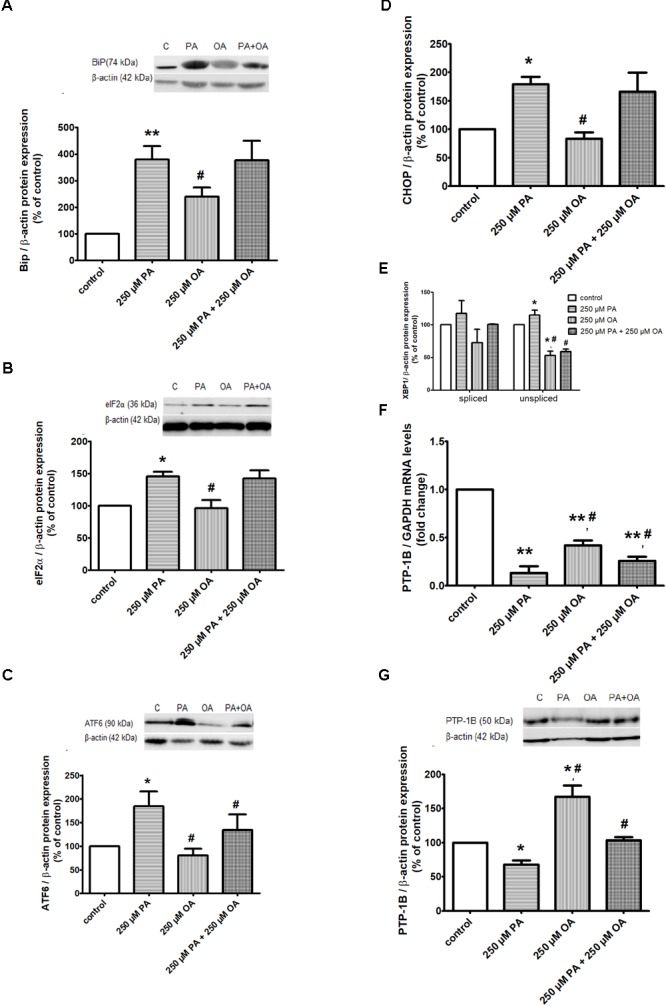
FIGURE 3.

ER proteins in free FFA-treated β cells and control β cells in 11 mM glucose. Proteic expression of Bip chaperone (A), translation initiation factor eIF2α (B), UPR transcriptional factors ATF6 (C), XBP1 (D), CHOP (E). The mRNA (F) and protein (G) expression levels of PTP-1B. The β cells were supplemented with media either alone or containing 250 μM PA, 250 μM OA or 250 μM PA + 250 μM OA for 24 h. All experiments were performed in triplicate. Each protein expression or gene expression was normalized to β-actin, GAPDH, respectively, and plotted as the percentage relative band density. Data are shown as mean ± SEM of five independent experiments. The statistical significance, noticeably different, was represented as ∗P ≤ 0.05, ∗∗P ≤ 0.01 for values PA/OA/PA + OA effects vs. control, and #P ≤ 0.05, ##P ≤ 0.01 for values OA/PA + OA effects vs. PA effects. The preconfluent human β cells left untreated with FFAs (PA and/or OA) were taken as control.
