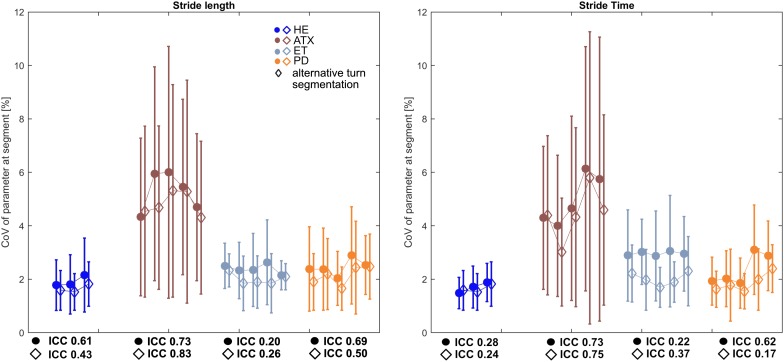
FIGURE 3.
Characteristics of Intraclass Coefficients (ICC) for stride length and stride time CoVs calculated for each segment. Square markers depict averages of CoVs on group level for each segment, Whiskers indicate standard deviation (SD) of each segment. Diamond markers show averages of CoVs on group level after alternative turn segmentation of ±1 stride around turns. Respective ICC values for both approaches are stated underneath HE und patient subgroup graphs.

