
FIGURE 3.
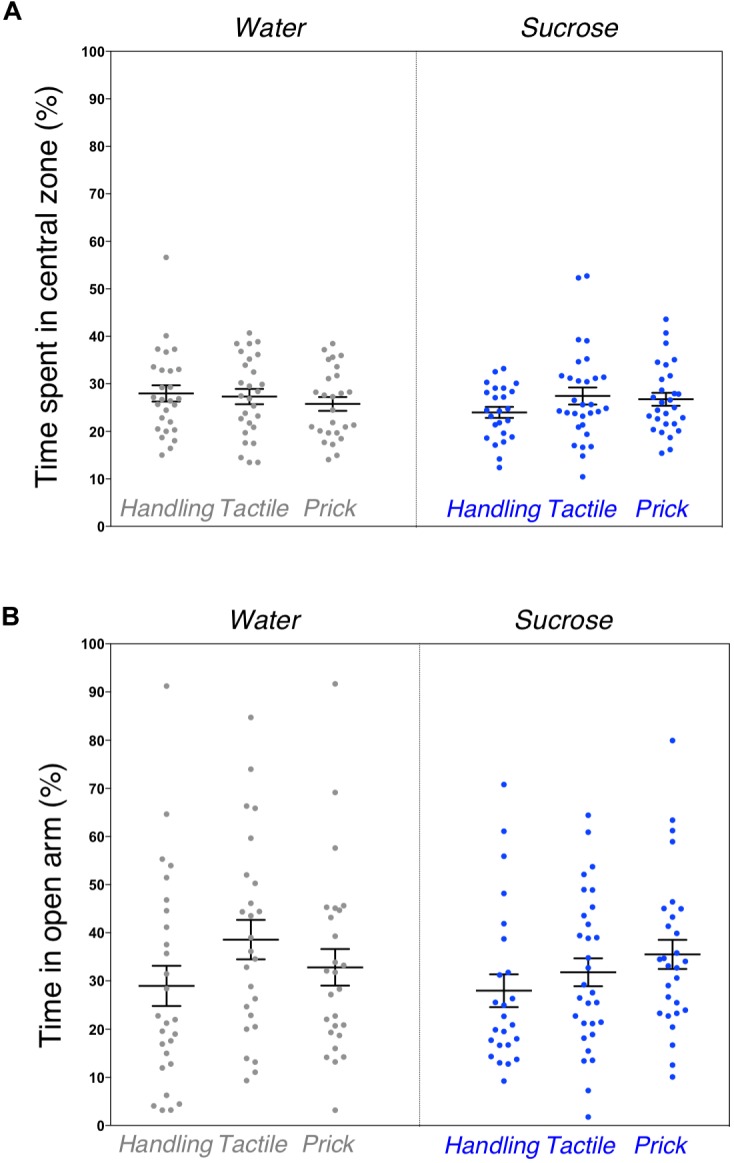
Assessment of anxious behavior after neonatal repeated exposure to treatment prior to an intervention. Box plots comparing six experimental groups (A) showing the time spent in central zone of a novel environment measured during the open field test (p = 0.55). (B) Percent of time spent in open arms of an elevated plus maze (p = 0.32). Data presented as scatter plots with mean ± SEM; horizontal bars represent mean values; black asterisks and bars denote statistical significance using ANOVA. n = 24–27 per group.