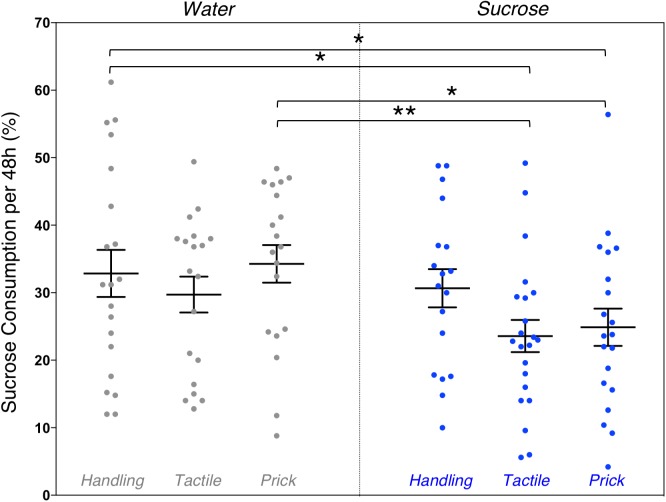
FIGURE 5.
Effects of treatment and intervention on sugar preference test. Group comparisons of percent of 10% sucrose water consumed from the total liquid consumption during the 48 h sugar preference test. Compared to adult mice in the Water/Handling group (controls), those in the Sucrose/Tactile (p = 0.019) and Sucrose/Needle-prick (p = 0.047) groups consumed significantly less 10% sucrose water. Adult mice in the neonatal Sucrose/Tactile (p = 0.008) and Sucrose/Needle-prick (p = 0.021) groups consumed significantly less 10% sucrose water compared to those in the Water/Needle-prick group. Data presented as scatter plots with mean ± SEM; horizontal bars represent mean values; black asterisks and bars denote statistical significance using ANOVA. n = 18–22 per group. ∗p < 0.05; ∗∗p < 0.01.

