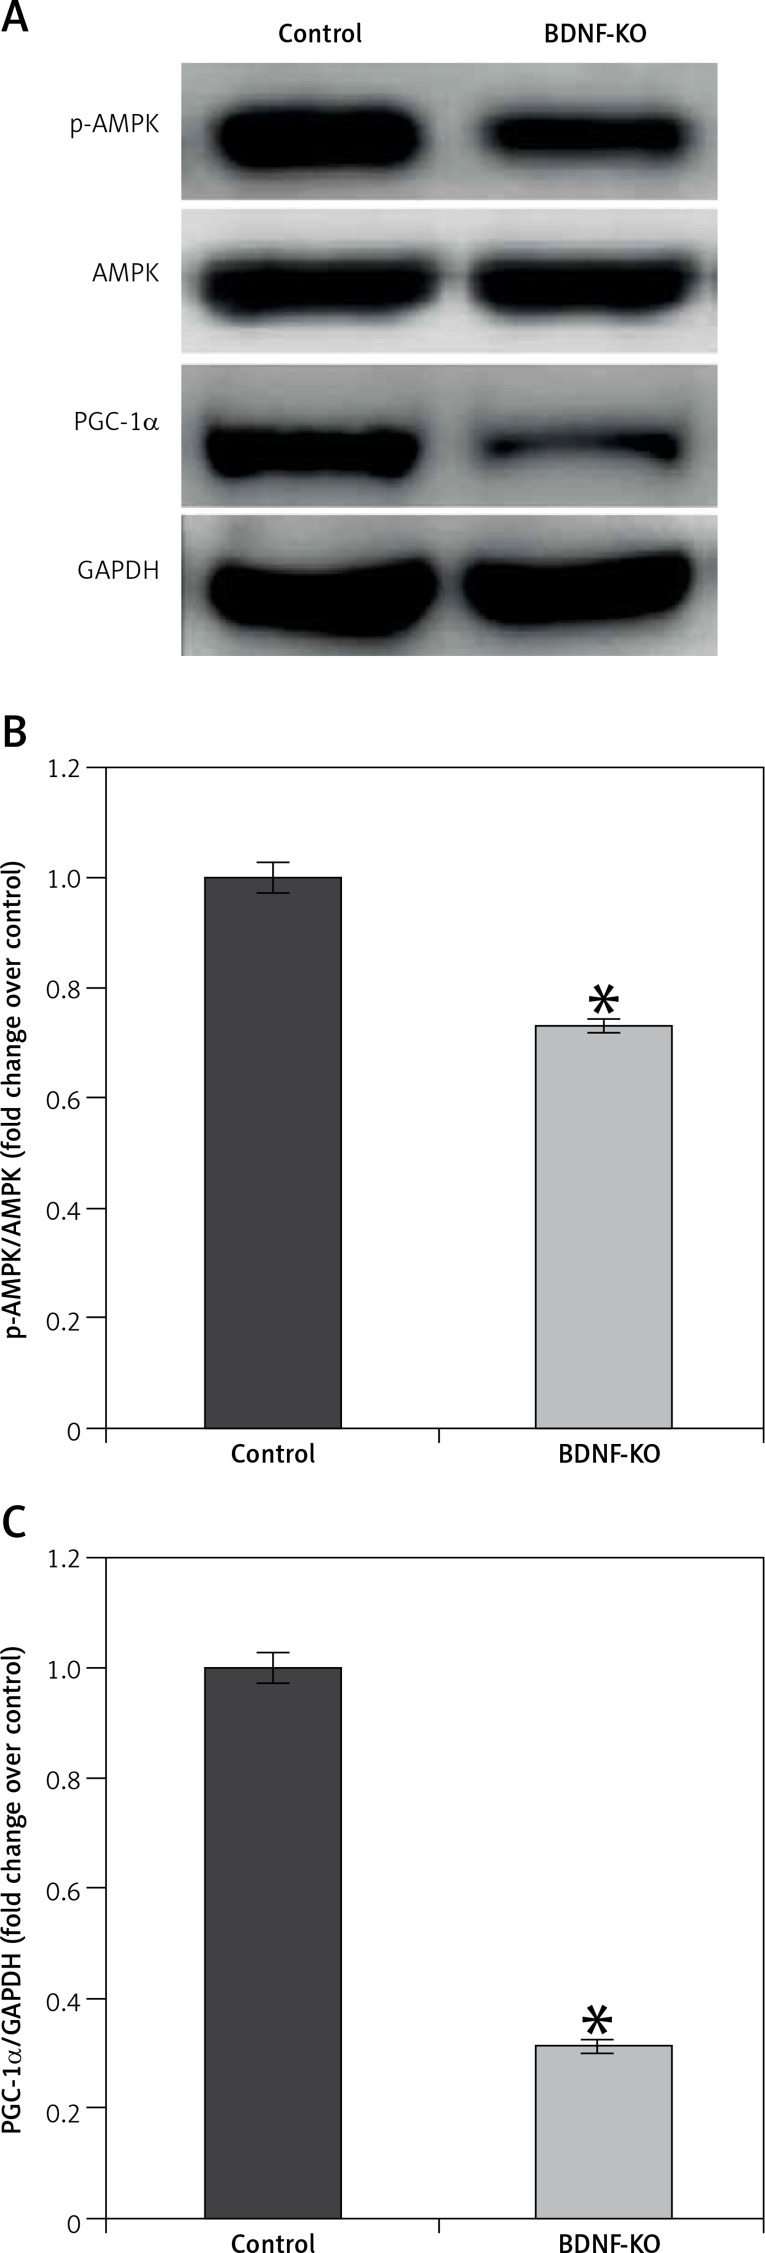
Figure 5.
P-AMPK and PGC-1α expression in untreated and BDNF siRNA treated C2C12 myoblasts. A – Representative blots of p-AMPK and PGC-1α. B, C – Relative protein band density values of p-AMPK and PGC-1α were calculated as the ratio of protein of interest to that of GAPDH
Data are presented as means ± SE. *P < 0.05 vs. Control group.

