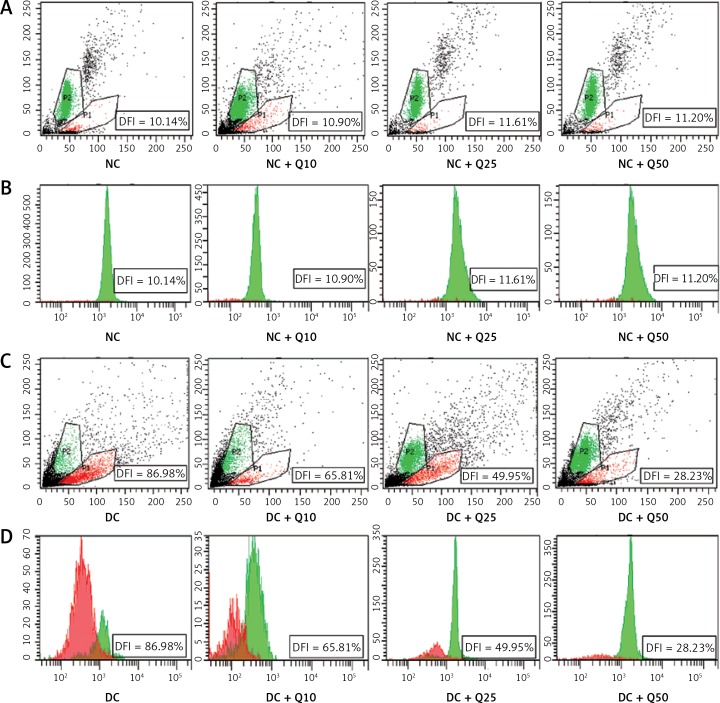
Figure 2.
Sperm DNA fragmentation index (A, C). Scattergram represents fluorescence intensity of fragmented DNA (P1; red color, x-axis) versus double-stranded DNA (P2; green color, y-axis). Cytogram dots represent single sperm with dual-parameter green and red fluorescence acquired at 10-bit resolution on flow cytometer. Debris (bottom left corner) was excluded from the analysis. B and D – frequency distribution histogram of DNA fragmentation index (DFI). The area with red color represents fragmented DNA, area with green color represents double standard DNA
Values represent mean ± SEM of six rats. *P < 0.05 compared to NC, #p < 0.05 compared to DC. NC – normal control, DC – diabetic control, NC + Q10 – normal receiving 10 mg/kg/b.w. quercetin, NC + Q25 – normal receiving 25 mg/kg/b.w. quercetin, NC + Q50 – normal receiving 50 mg/kg/b.w. quercetin, DC + Q10 – diabetic receiving 10 mg/kg/b.w. quercetin, DC + Q25 – diabetic receiving 25 mg/kg/b.w. quercetin, DC + Q50 – diabetic receiving 50 mg/kg/b.w. quercetin.

