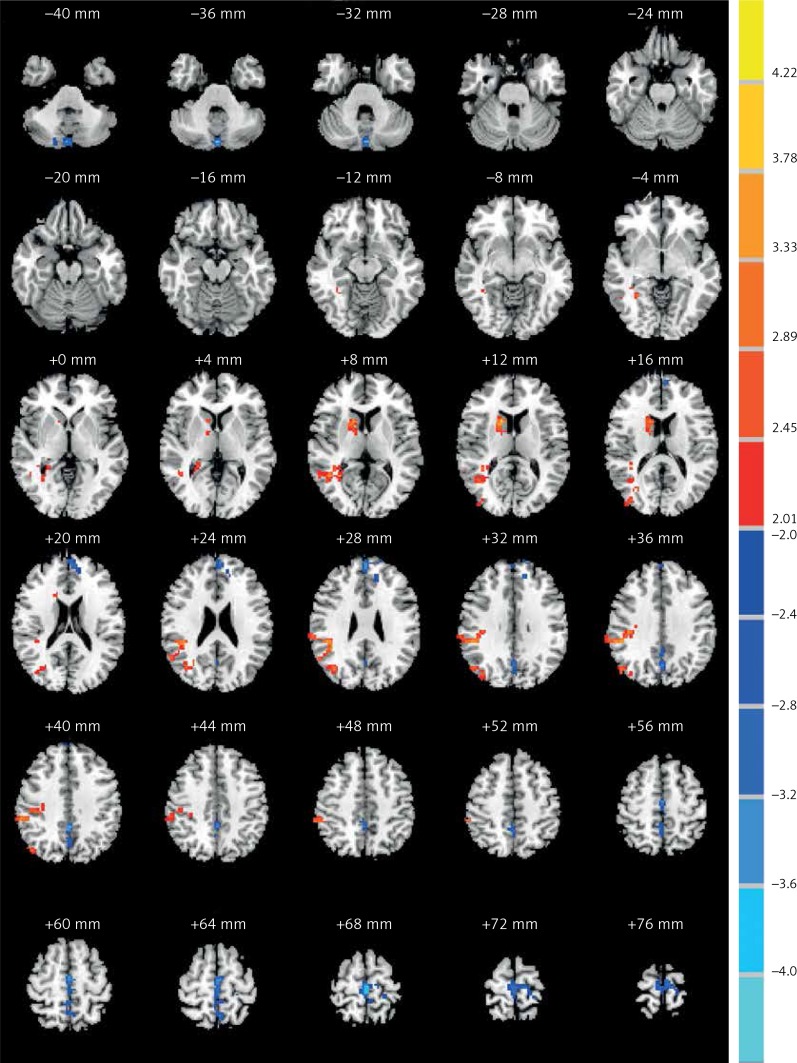
Figure 1.
Comparisons of the ALFF between COS and normal controls (p < 0.05, AlphaSim corrected). The red color represents higher ALFF values in the COS group, whereas blue color represents lower ALFF values. Compared with controls, the COS group showed significantly increased ALFF in the right caudate body, middle temporal gyrus and inferior parietal lobule, while showing decreased ALFF in the left cerebellum posterior lobe

