Figure 6.
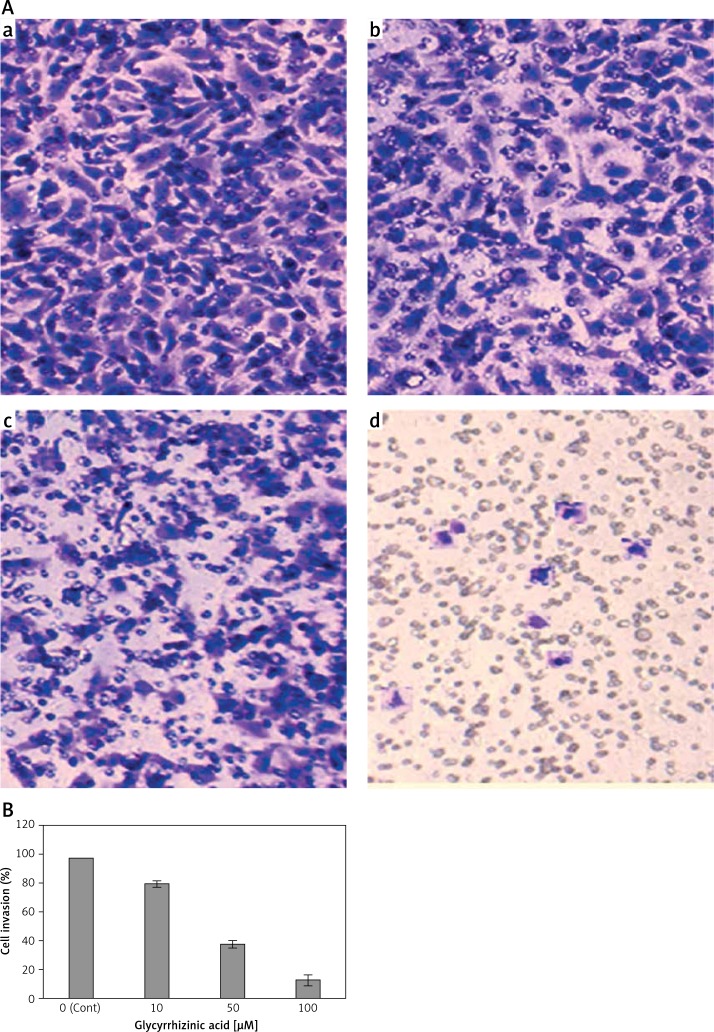
A – Glycyrrhizinic acid led to inhibition of cell invasion in MCF-7 human breast cancer cells. The cells were treated with 0 (a), 10 (b), 50 (c) and 100 µM (d) doses of glycyrrhizinic acid for 48 h. B – Bar graph showing the percentage of the invasive cells at the indicated concentrations of the drug
Data are shown as the mean ± SD of three independent experiments. *P < 0.05, **p < 0.01, vs. 0 μM (control).

