. 2019 Jan 3;16(1):21–27. doi: 10.21873/cgp.20109

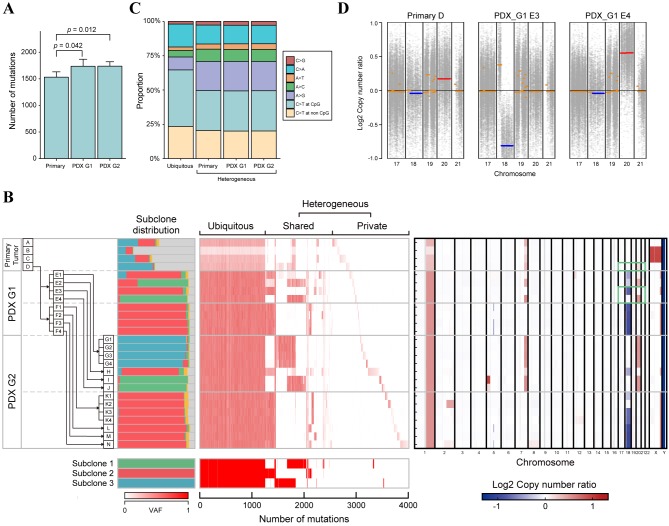
Figure 2. The genomic landscape and clonal dynamics of colorectal cancer indicated by patient-derived xenograft (PDX) mice in the multiregional sequencing approach (MRA). A: Bar plots representing the number of mutations in the primary and in PDX tumors. p-Values were calculated using the Wilcoxon rank-sum test. B: Multiregion genomic profiles of primary and PDX tumors. Left: The history of passaging in PDX-MRA and the subclonal structure inferred by Clomial. Major tumor subclones are depicted as green, red and blue, while minor tumor subclones and noncancerous subclones are depicted as yellow and gray, respectively. Middle: Variant allele frequencies (VAFs) of all mutations are presented as a heat map. Bottom: Mutation patterns of subclones inferred by Clomial. Right: The copy number alteration (CNA) profile of CRC in PDX-MRA inferred by CNV kit. Heat map represents the presence of CNAs (red, amplification; blue, deletion). Green boxes represent the chromosomal regions indicated in Figure 2D. C: Stacked bar plots representing mutational signatures calculated from ubiquitous mutations and heterogeneous mutations in PDXMRA. The mutational signatures of heterogeneous mutations were calculated for primary, first-generation PDX (G1) and second-generation PDX (G2) tumors. D: Copy number plots representing chromosomal amplification (red) and deletion (blue) in the primary tumor and PDX tumor.

Figure 2