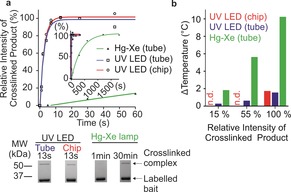
Figure 2.

a) Densitometry quantification of the appearance of OmpA(W7C)[MTS‐diazirine] crosslinked to Skp vs. irradiation time. Inset: expanded time axis to show full time course using the Hg‐Xe lamp. Lines are exponential fits to the data. Relative intensity of crosslinked product [%] was calculated as the intensity of the crosslinked product band on an SDS‐PAGE gel at time t divided by the intensity at t final, assuming the maximal yield is achieved when the graph plateaus (see example SDS‐PAGE of the XL reaction (bottom) and Figure S4c). b) Sample heating at irradiation times required to reach 15, 55 and 100 % maximal crosslinked product for the Hg‐Xe and UV LED lamps. n.d.=not determined.
