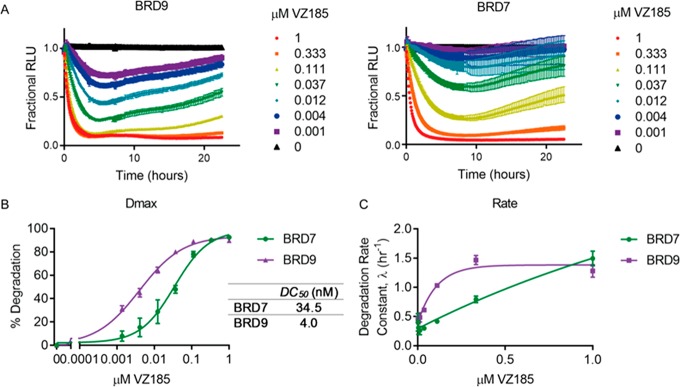
Figure 9.
Quantitative live-cell kinetics of VZ185 induced degradation of BRD7 and BRD9. Degradation profile (A), calculation of DC50 values (B), and initial degradation rate (C) across concentration series indicated of VZ185 using continual luminescent reading of CRISPR/Cas9 endogenously tagged HiBiT-BRD7 or HiBiT-BRD9 in HEK293 cells. Error bars are expressed as SEM taken from n = 3 experiments.

