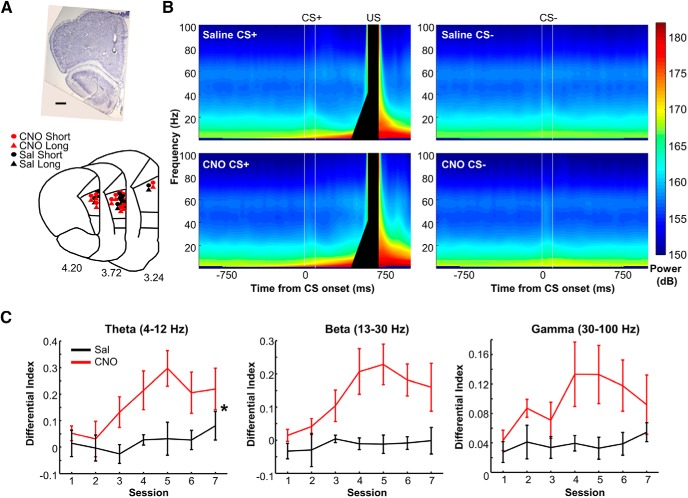
Figure 3.
CS-evoked theta amplitude was selective for relevant temporal stimulus correlations. A, Representative image of electrode tip location in the prelimbic region of mPFC (top) and histologic reconstruction of electrode locations (bottom) in the CNO-treated (red) and saline-treated (black) hM3Dq-expressing rats included in neurophysiological analyses. The locations of shorter and longer tips of bipolar electrodes are depicted as circles and triangles, respectively. Scale bar, 500 μm. B, Spectrograms during the differential learning stage showing the power of oscillations averaged across sessions and rats in each group. Two white lines show CS onset and offset. Black bars mask the artifact generated by the US. C, The degree of differentiation of the CS-evoked oscillatory amplitude between the reinforced and unreinforced CS during the differential learning stages (mean ± SEM; saline: n = 8 rats; CNO: n = 9 rats). The amplitude of theta band activity (4–12 Hz) differentiated two CS types, and the differentiation was stronger in CNO-treated (red) than saline-treated (black) rats. *p < 0.05 (mixed ANOVA).

