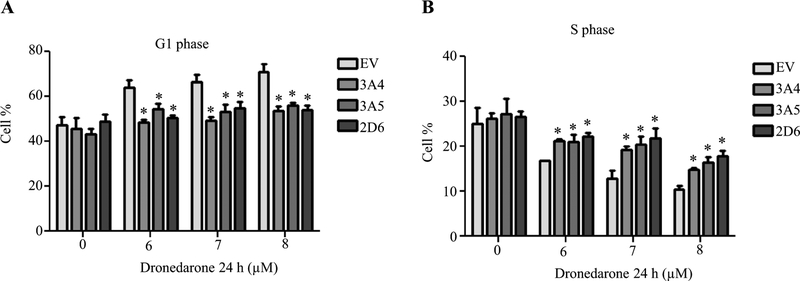
Fig. 5.
Empty vector (EV)-transduced or CYP3A4, 3A5, and 2D6-overexpressing HepG2 cells were treated with the indicated concentrations of dronedarone for 24 h. a, b Cell cycle distribution was measured by flow cytometer. Bar graph represents the mean percentage of cell cycle G1 phase (a) and S phase (b) ± SD from three independent experiments. *p < 0.05 compared with EV control

