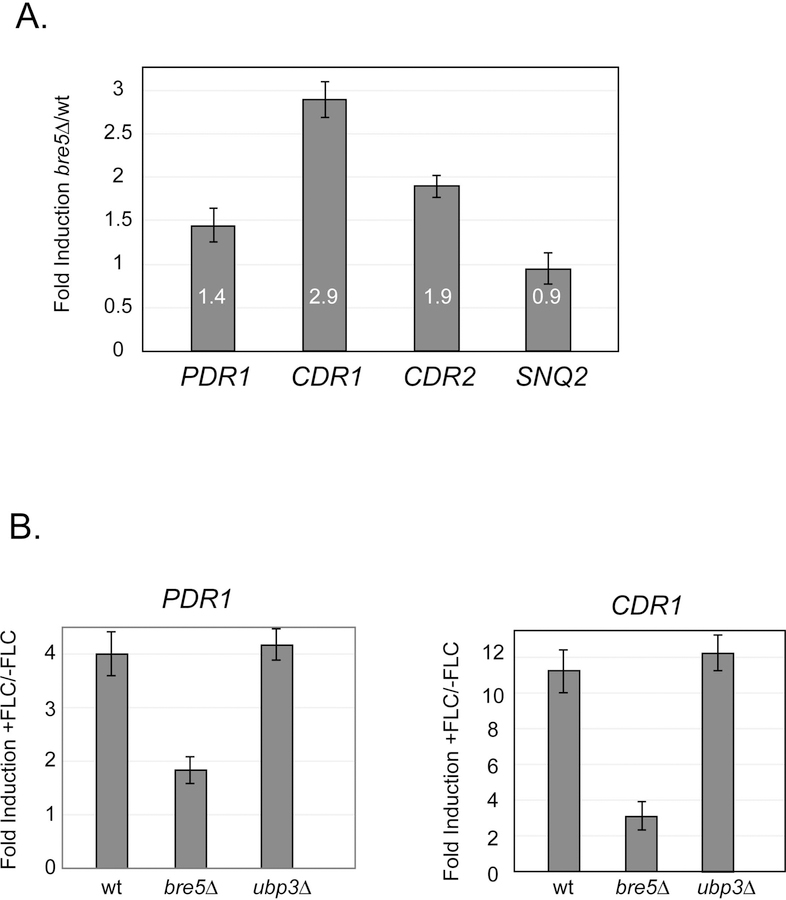
Figure 4. Loss of Bre5 stimulates Pdr1-regulated gene expression.
A. Total RNA was isogenic wild-type and bre5Δ cells grown to mid-log phase. Levels of mRNA for genes of interest was determined using gene-specific primers and reverse transcription-quantitative PCR (RT-qPCR) analyses. All mRNA levels were normalized to expression of TEF1 mRNA which served as an unaffected control. Values listed inside each bar are the averages of at least 3 independent determinations of mRNA and represent a ratio of transcription in bre5Δ cells/transcription in the wild-type strain. B. Isogenic strains corresponding to the wild-type, bre5Δ and ubp3Δ were grown to early log phase and then either treated with fluconazole (+FLC) or allowed to continue to grow for 90 minutes with no treatment (-FLC). Total RNA was prepared after this time and analyzed for expression of either PDR1 or CDR1 by RT-qPCR. Levels of these transcripts were normalized to TEF1 as above. Values presented are a ratio of expression in presence of fluconazole relative to expression in the absence of drug.

