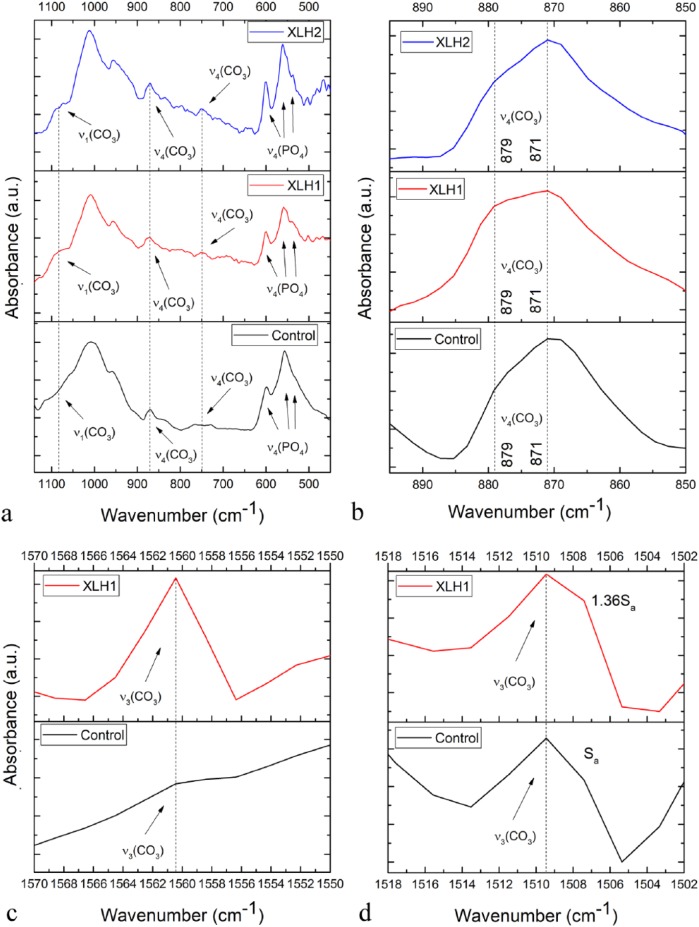
Figure 5.
FTIR spectra of the permanent tooth dentins derived from individuals with XLH and the healthy control in: (a) the 1150–450 cm−1 region, showing the most prominent phosphate and carbonate bands in the dentin spectrum; (b) 900–850 cm−1 region, showing the ν4(CO3) band and distinguishing between A-type (879 cm−1) and B-type (871 cm−1) carbonate substitutions; (c) 1570–1550 cm−1 region, showing one far blue end component of the ν3(CO3) multiplet; and (d) 1508–1502 cm−1 region, showing another far blue end component of the ν3(CO3) multiplet. Sa denotes the integrated intensity of the ν3(CO3) band.
FTIR, Fourier transform infrared; XLH, X-linked hypophosphatemia.

