Figure 3.

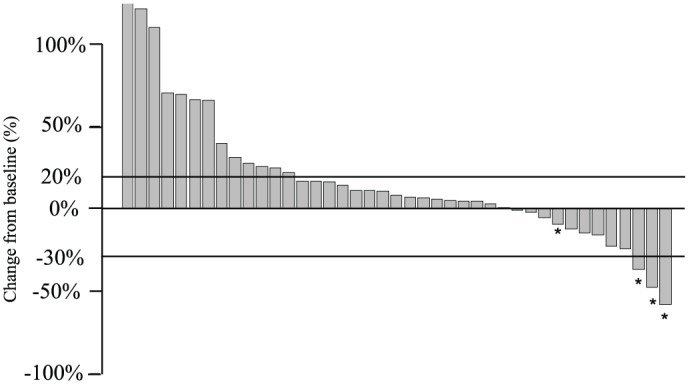
Change in tumor size. Waterfall plot showing the best percentage change from baseline in tumor measurement using RECIST version 1.1.
*Patients who were treated with study drugs in clinical trials.

Change in tumor size. Waterfall plot showing the best percentage change from baseline in tumor measurement using RECIST version 1.1.
*Patients who were treated with study drugs in clinical trials.