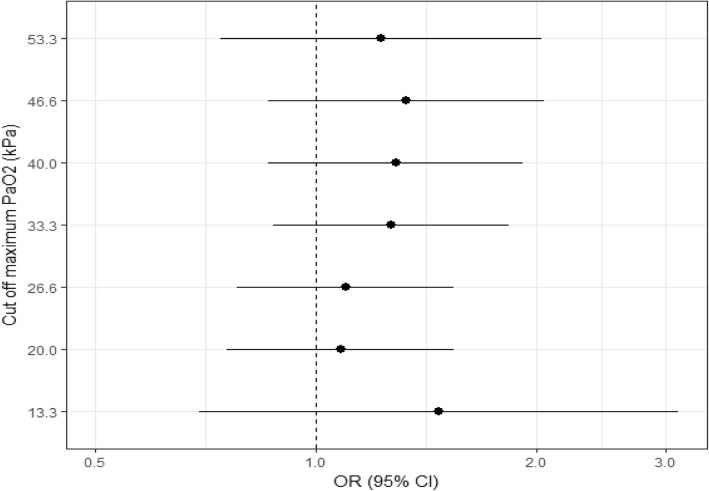
Fig. 3.
Forrest plot showing the adjusted OR’s (bullet points) with 95% CI’s (horizontal lines) for poor neurological outcome according to Cerebral Performance Category (CPC) for different PaO2 threshold values. OR, odds ratio. CI, confidence interval. PaO2, partial pressure of oxygen. kPa, kilopascal. CPC, cerebral performance category. CPC 1-2, good outcome, CPC 3-5, poor outcome. ORs and CIs are presented on a logarithmic scale. OR above 1.0 indicates worse outcome above the PaO2 threshold and OR below 1.0 indicates better outcome above the PaO2 threshold

