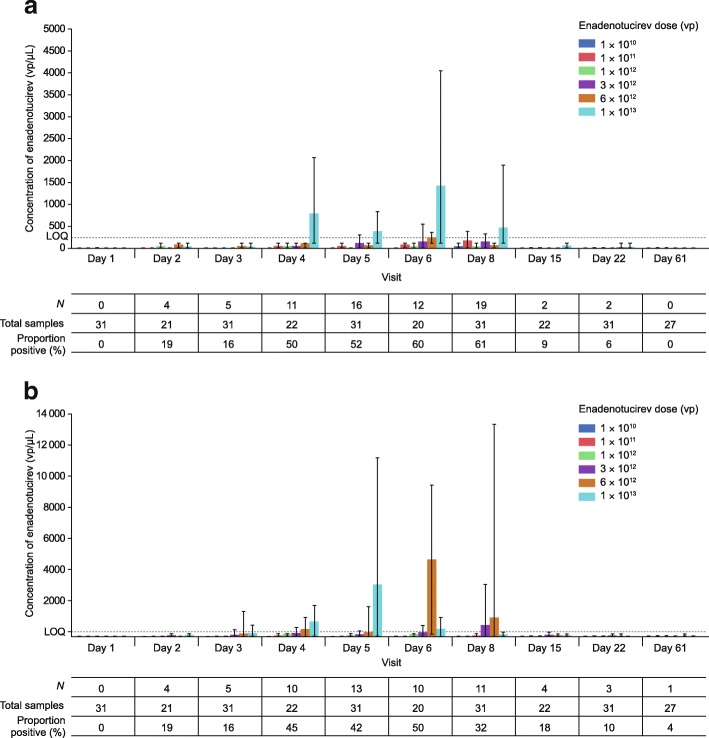
Fig. 3.
Post-infusion viral shedding during phase 1a. a Mean buccal shedding as quantified by qPCR with solid bars representing the mean and error bars representing the range observed. The number of patients in whom buccal shedding was detected (N; > 0 vp/μL) is represented by N. The total number of samples represents the number of samples taken at each time point. The proportion positive is the percentage of samples in which buccal shedding was detected across all cohorts. b Mean rectal shedding as quantified by qPCR with bars representing the mean and error bars the range observed. The number of patients in whom rectal shedding was detected (N; > 0 vp/μL) is represented by N. The total number of samples represents the number of samples taken at each time point. The proportion positive is the percentage of samples in which buccal shedding was detected across all cohorts. LOQ level of quantification, N number, qPCR quantitative polymerase chain reaction, vp viral particle(s)

