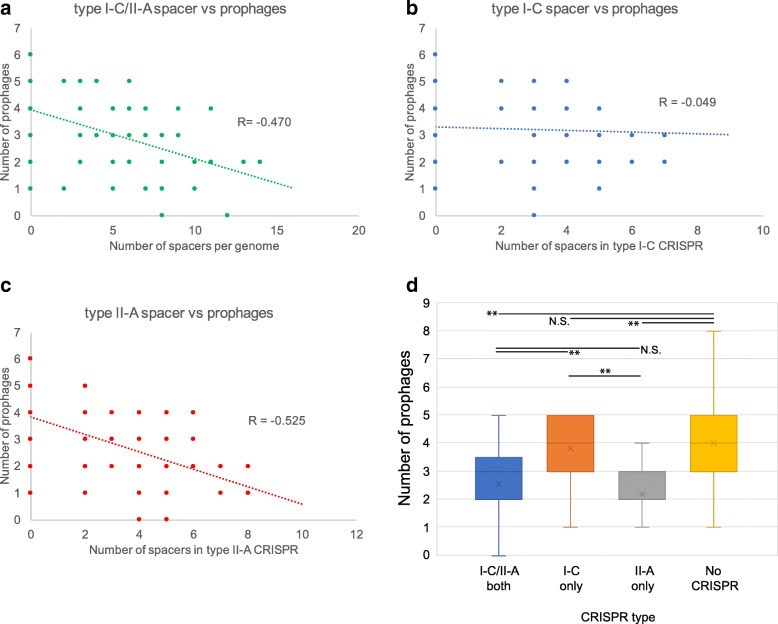
Fig. 3.
Correlation between the number of spacer sequences and prophages. a-c The number of spacers in each strain is plotted against the number of prophages in scatter graphs for types I-C and II-A (a), type I-C (b), and type II-A CRISPR/cas (c). Spearman’s rank correlation coefficients are indicated as R values. d The number of prophages in each GAS genome harboring various type of CRISPR are shown using box plots.“×” indicates median of the number of prophages. Two asterisks indicate statistical significance at p < 0.01, and N.S. indicates non-significance

