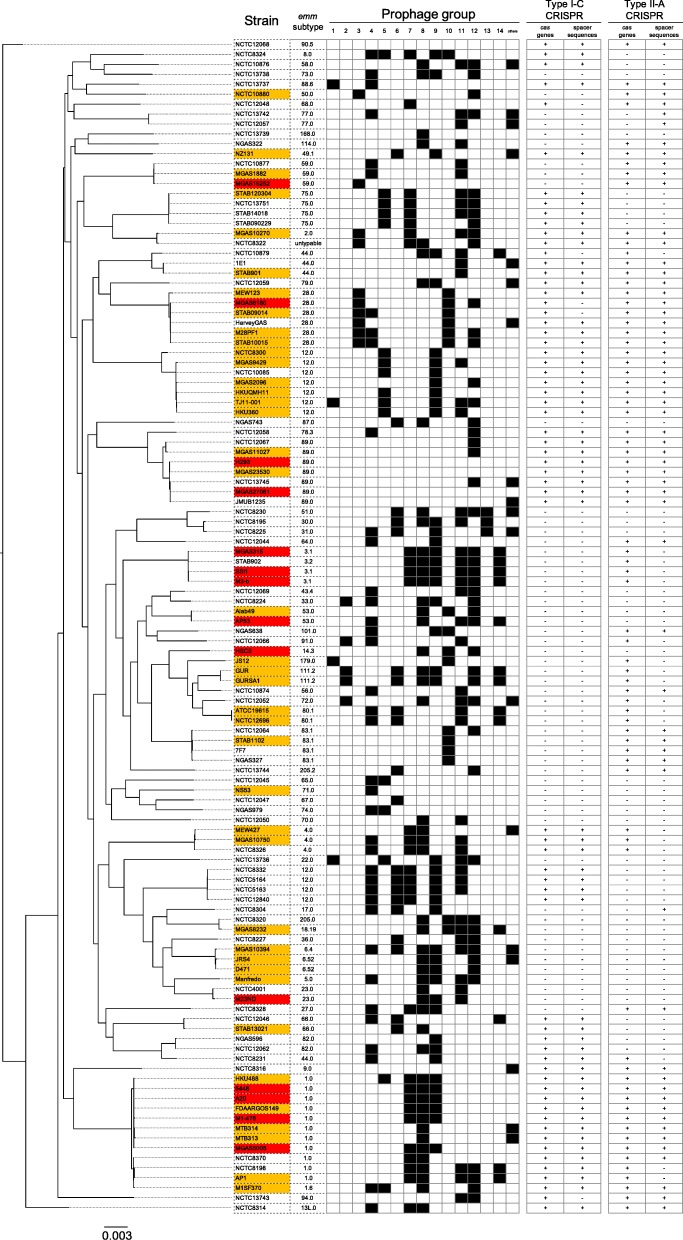
Fig. 5.
Phylogenetic analysis of 118 GAS strains with clinical symptom, M-type, prophage group, and CRISPR/cas data. The maximum likelihood phylogenetic tree was constructed from 715 CDSs by the GTR substitution model, and is shown on the left. The strains with severe and mild symptoms are indicated by red and orange, respectively, and strains with asymptomatic or unknown symptoms are not colored. The presence and absence of prophages are indicated by filled and open boxes, respectively, for the 14 prophage groups listed horizontally. The presence and absence of cas genes and CRISPR are represented by “+” and “-”, respectively

