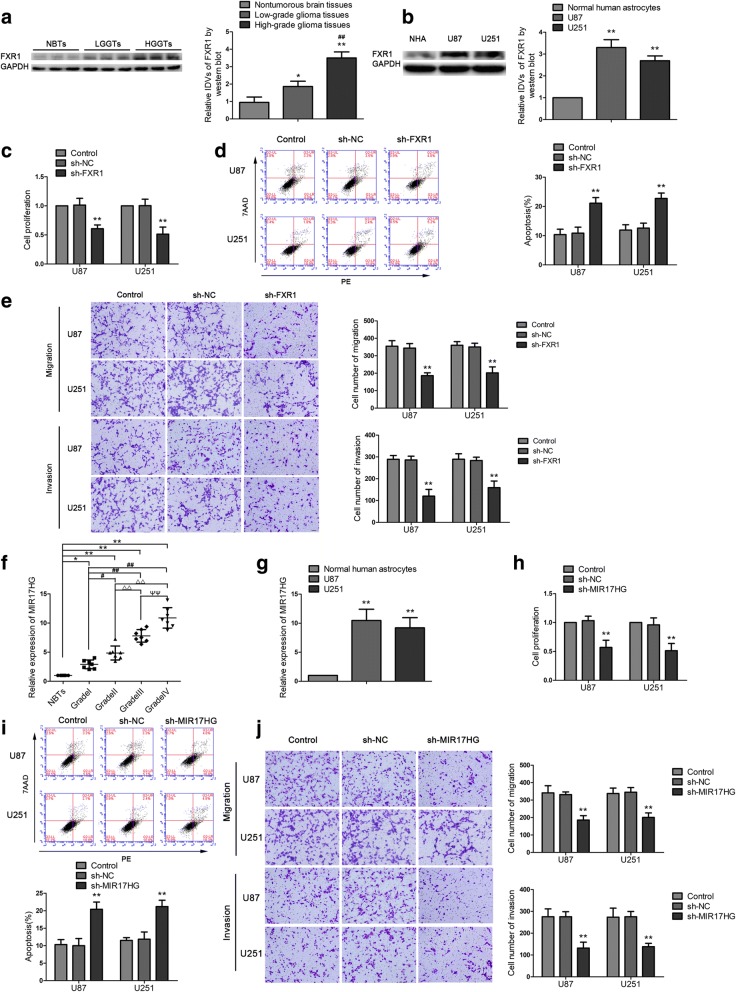
Fig. 1.
The expression and effect of FXR1 and MIR17HG on the biological behavior of glioma cells. a FXR1 protein expression levels in nontumorous brain tissues (NBTs), low-grade glioma tissues (WHO I-II), and high-grade glioma tissues (WHO III-IV). Data are presented as the mean ± SD (n = 3 in each group). *P < 0.05, **P < 0.01 versus NBTs group; ##P < 0.01 versus low-grade glioma tissues group. b FXR1 protein expression levels in normal human astrocytes (NHA), U87 and U251 cells. Data are presented as the mean ± SD (n = 3 in each group). **P < 0.01 versus NHA group. c, h CCK-8 assay was conducted to investigate the effect of FXR1 (MIR17HG) on proliferation of U87 and U251 cells. d, i Flow cytometry analysis to evaluate the effect of FXR1 (MIR17HG) on the apoptosis of U87 and U251 cells. e, j Transwell assays were used to measure the effect of FXR1 (MIR17HG) on cell migration and invasion of U87 and U251 cells. Data are presented as the mean ± SD (n = 3 in each group). *P < 0.05, **P < 0.01 versus sh-NC group (empty vector); Scale bars represent 40 μm. f The expression of MIR17HG in glioma tissues of different grades and NBTs. Data are presented as the mean ± SD (n = 7 in each group). *P < 0.05, **P < 0.01 versus NBTs group; #P < 0.05, ##P < 0.01 versus Grade I group; △△P < 0.01 versus Grade II group; ΨΨP < 0.01 versus Grade III group. g The expression of MIR17HG in NHA and glioma cell lines (U87 and U251). Data are presented as the mean ± SD (n = 3 in each group); **P < 0.01 versus NHA group. Using one-way analysis of variance for statistical analysis

