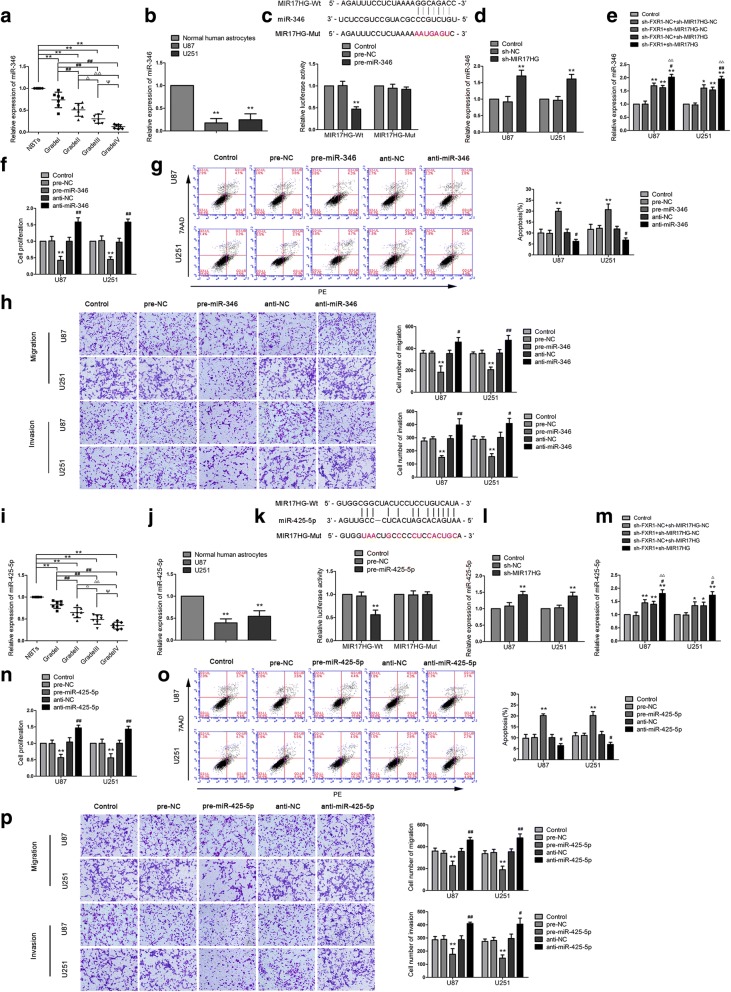
Fig. 3.
Overexpression of miR-346 and miR-425-5p inhibited the malignant progression of glioma cells. a, i Expression levels of miR-346 (miR-425-5p) in NBTs and glioma tissues. Data are presented as the mean ± SD (n = 7 in each group). **P < 0.01 versus NBTs group; ##P < 0.01 versus Grade I group; △P < 0.05, △△P < 0.01 versus Grade II group; ΨP < 0.05, ΨΨP < 0.01 versus Grade III group. b, j Expression levels of miR-346 (miR-425-5p) in NHA and glioma cell lines. Data are presented as the mean ± SD (n = 3 in each group). **P < 0.01 versus NHA group. c, k The predicted miR-346 (miR-425-5p) binding sites in the MIR17HG (MIR17HG-Wt) and/or the designed mutant sequence (MIR17HG-Mut) are indicated. Relative luciferase activity was conducted after cells were transfected with MIR17HG-Wt or MIR17HG-Mut. **P < 0.01 versus MIR17HG-Wt + pre-NC. d, l Real-time qPCR analysis for MIR17HG regulating miR-346 (miR-425-5p) expression in U87 and U251 cells. **P < 0.01 versus sh-NC group. e, m Real-time qPCR analysis for FXR1 and MIR17HG regulating miR-346 (miR-425-5p) expression in U87 and U251 cells. Data were presented as the mean ± SD (n = 3 in each group). *P < 0.05, **P < 0.01 versus sh-FXR1-NC + sh-MIR17HG-NC group; #P < 0.05, ##P < 0.01 versus sh-FXR + sh-MIR17HG-NC group; △P < 0.05, △△P < 0.01 versus sh-FXR1-NC + sh-MIR17HG group. f, n CCK-8 assay was used to measure the proliferative effect of miR-346 (miR-425-5p) on U87 and U251 cells. g, o Flow cytometry analysis of U87 and U251 with the altered expression of miR-346 (miR-425-5p). h, p Transwell assays were used to measure the effect of miR-346 (miR-425-5p) on cell migration and invasion of U87 and U251 cells. Data are presented as the mean ± SD (n = 3 in each group). **P < 0.01 versus pre-NC group; #P < 0.05, ##P < 0.01 versus anti-NC group. Scale bars represent 40 μm. Using one-way analysis of variance for statistical analysis

