Fig. 7.
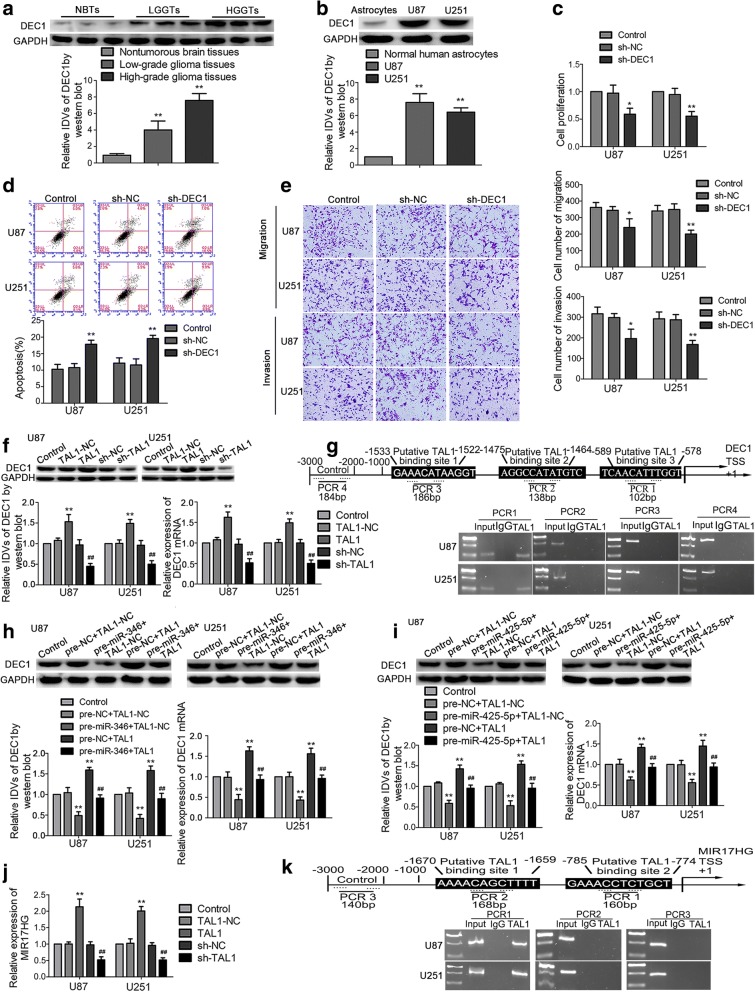
DEC1 was upregulated in glioma tissues and cells and played oncogenic role in glioma cells. a DEC1 protein expression levels in NBTs and glioma tissues. **P < 0.01 versus NBTs group; ##P < 0.01 versus low-grade glioma tissues group. b DEC1 protein expression levels in astrocytes, U87, and U251 cells. Data are presented as the mean ± SD (n = 3 in each group). **P < 0.01 versus human normal astrocytes group. c CCK-8 assay was used to measure the proliferation effect of DEC1 on U87 and U251 cells. d Flow cytometry analysis of U87 and U251 cells with the altered expression of DEC1. e Transwell assays were used to measure the effect of DEC1 on cell migration and invasion of U87 and U251 cells. Scale bars represent 40 μm. Data are presented as the mean ± SD (n = 3 in each group). *P < 0.05, **P < 0.01 versus sh-NC group. f qRT-PCR and western blot analysis for TAL1 regulating DEC1 expression in U87 and U251 cells. **P < 0.01 versus TAL1-NC group; ##P < 0.01 versus sh-NC group. g TAL1 bound to the promoter of DEC1 in U87 and U251 glioma cells. Putative TAL1 binding sites are indicated. Immunoprecipitated DNA was amplified by PCR. Normal rabbit IgG was used as a negative control. h, i qRT-PCR and western blot assay were used to detect the DEC1 expression regulated by miR-346 (miR-425-5p) and TAL1. **P < 0.01 versus pre-NC + TAL1-NC group; ##P < 0.01 versus pre-miR-346 (pre-miR-425-5p) + TAL1-NC group. j Real-time qPCR analysis for TAL1 regulating MIR17HG expression in U87 and U251 cells. Data are presented as the mean ± SD (n = 3 in each group). **P < 0.01 versus TAL1-NC group; #P < 0.05 versus sh-NC group. k TAL1 bound to the promoter of MIR17HG in U87 and U251 glioma cells. Putative TAL1 binding sites are indicated. Immunoprecipitated DNA was amplified by PCR. Normal rabbit IgG was used as a negative control. Using one-way analysis of variance for statistical analysis

