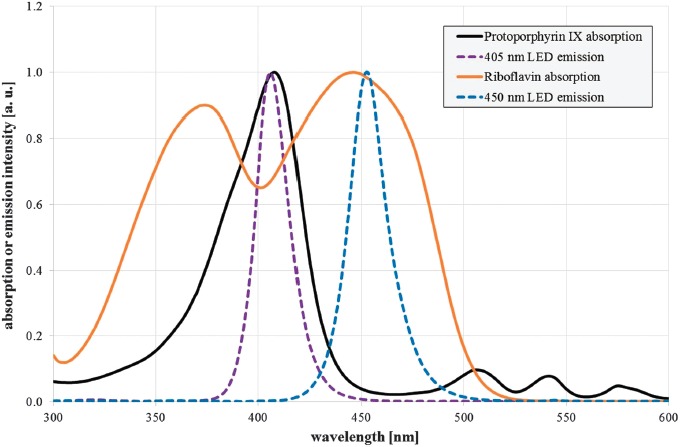
Figure 1.

Normalized absorption spectra of protoporphyrin IX in dimethyl sulfoxide (black solid line) and riboflavin in aqueous solution with pH 7.0 (orange solid line), as well as normalized emission spectra of the selected violet and blue LED (violet and blue dotted line)
