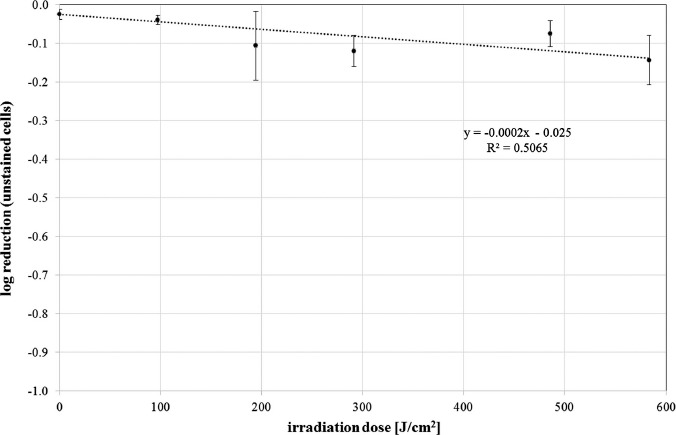
Figure 5.

Log reduction of unstained cells for increasing doses of 405 nm irradiation for S. cerevisiae (DSM no. 70449). Values are depicted with standard deviation. The spotted curve illustrates the straight line that was fitted to the data. The line equation is given together with the coefficient of determination R2 (mean values and standard deviations out of 2 independent experiments with at least 3 evaluated samples and assessment of about 32 images for each of these samples)
