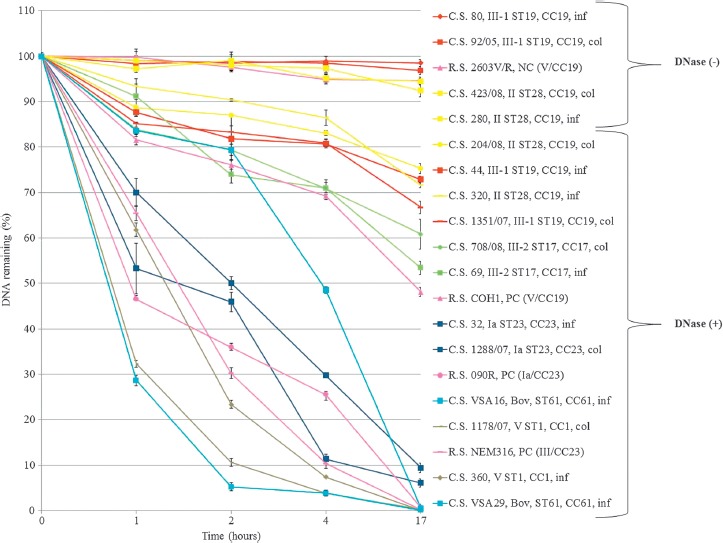
Figure 2.

Quantitative DNase assays displaying differential DNase activity between S. agalactiae strains over time. 1 μg of DNA (amplicon atr) incubated with 10 μl of S. agalactiae culture supernatant for 1h, 2h, 4h, overnight at 37°C. Fluorescent PicoGreen dye (Invitrogen) was used to quantify the dsDNA. The graphic displays the mean values of the experiment performed in duplicate. Error bars show ± standard deviation (see Supporting information Table 1). Col, Colonization; Inf, Infection; Bov, Bovine; C.S., Clinical Strain; R.S., Reference Strain; PC, Positive Control; NC, Negative Control
