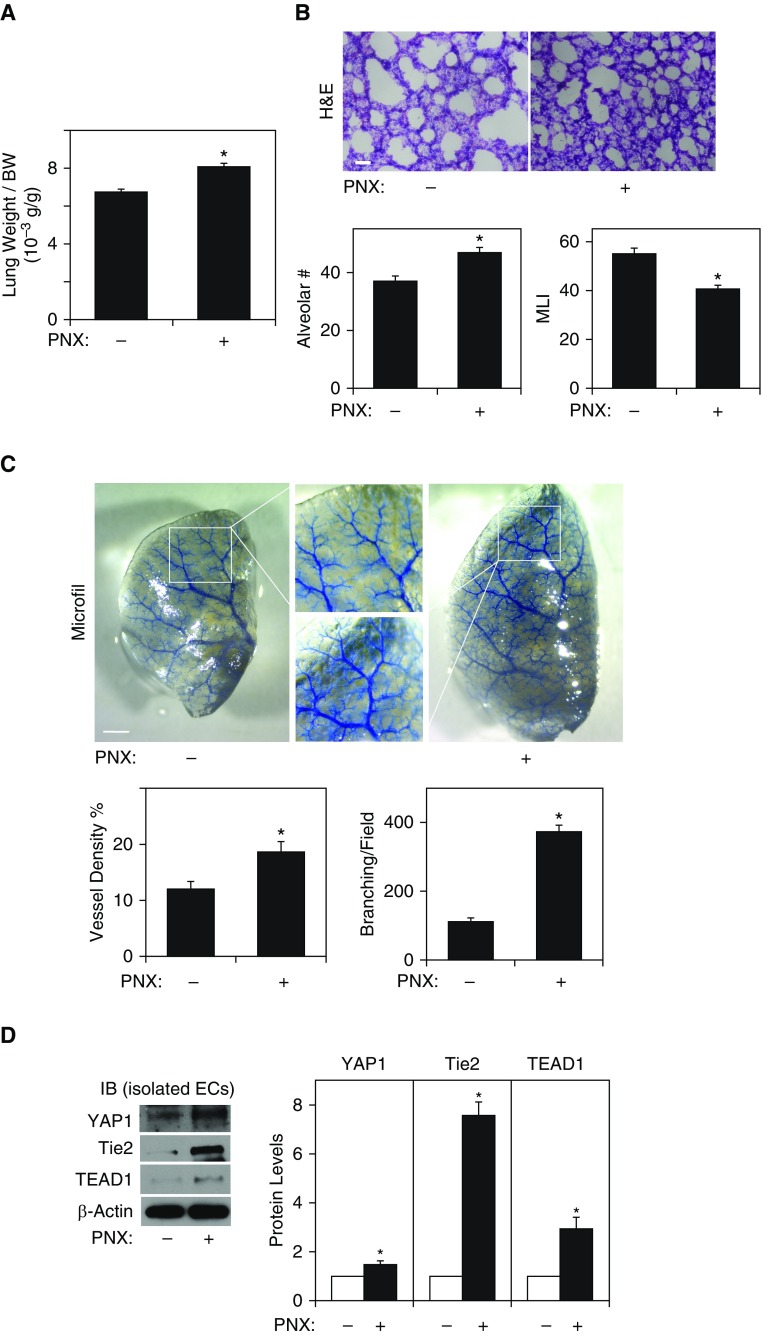
Figure 5.
Angiogenesis is stimulated in the mouse lung after pneumonectomy (PNX). (A) Graph showing the ratio of the weight of right lung cardiac lobe to mouse body weight (BW) 7 days after PNX (n = 7, mean ± SEM, *P < 0.05). (B) Hematoxylin and eosin (H&E)–stained remaining right cardiac lobe 7 days after left PNX (top). Scale bar: 25 μm. Graphs showing quantification of alveolar number (left bottom) and alveolar size (mean linear intercept [MLI], right bottom) in the remaining mouse lung right cardiac lobe 7 days after PNX (n = 7, mean ± SEM, *P < 0.05). (C) Micrographs showing blood vessel structures in the mouse right lung lobe 7 days after left PNX analyzed using the Microfil casting system (top). Scale bar: 1 mm. Graphs showing the quantification of blood vessel density (left bottom) and the number of branching points (right bottom, n = 7, mean ± SEM, *P < 0.05). (D) IB showing the protein levels of YAP1, Tie2, TEAD1, and β-actin in ECs isolated from mouse lungs 7 days after PNX (left). Graph showing the quantification of YAP1, Tie2, and TEAD1 protein levels in ECs isolated from mouse lungs 7 days after PNX (right, n = 4, mean ± SEM, *P < 0.05).

