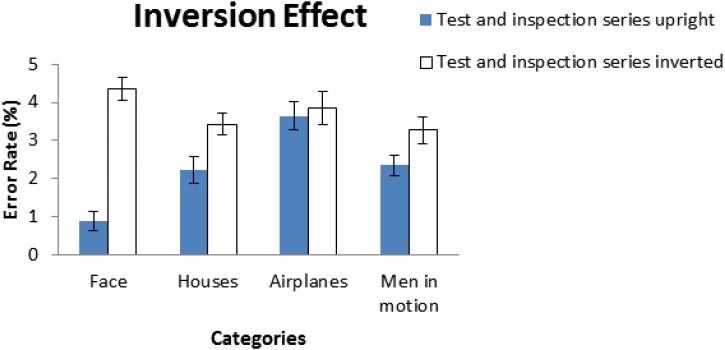
FIGURE 3.
In Yin (1969) study, there was a significant difference in performance between upright and inverted faces; in contrast, no significant differences were found for objects of non-face categories. The error bar indicates the mean of ±1 standard error. The figure was adapted and modified from Yin (1969).

