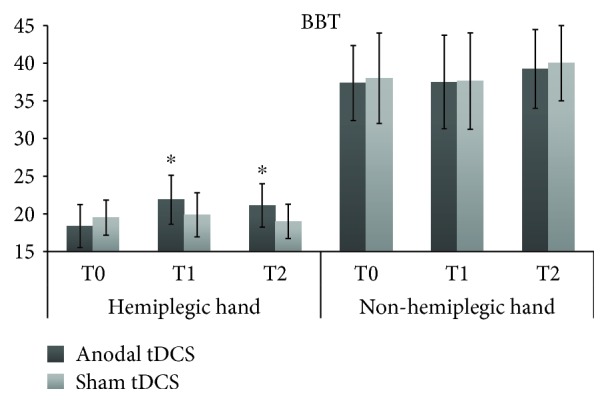
Figure 2.

BBT scores (i.e., number of blocks moved in 1 min) for the hemiplegic and nonhemiplegic hands, at each assessment of the active anodal tDCS and sham tDCS sessions. T0 = baseline; T1 = immediately after the end of tDCS; T2 = 90 min after the stimulation session. ∗ = significant change from baseline, p < 0.05.
