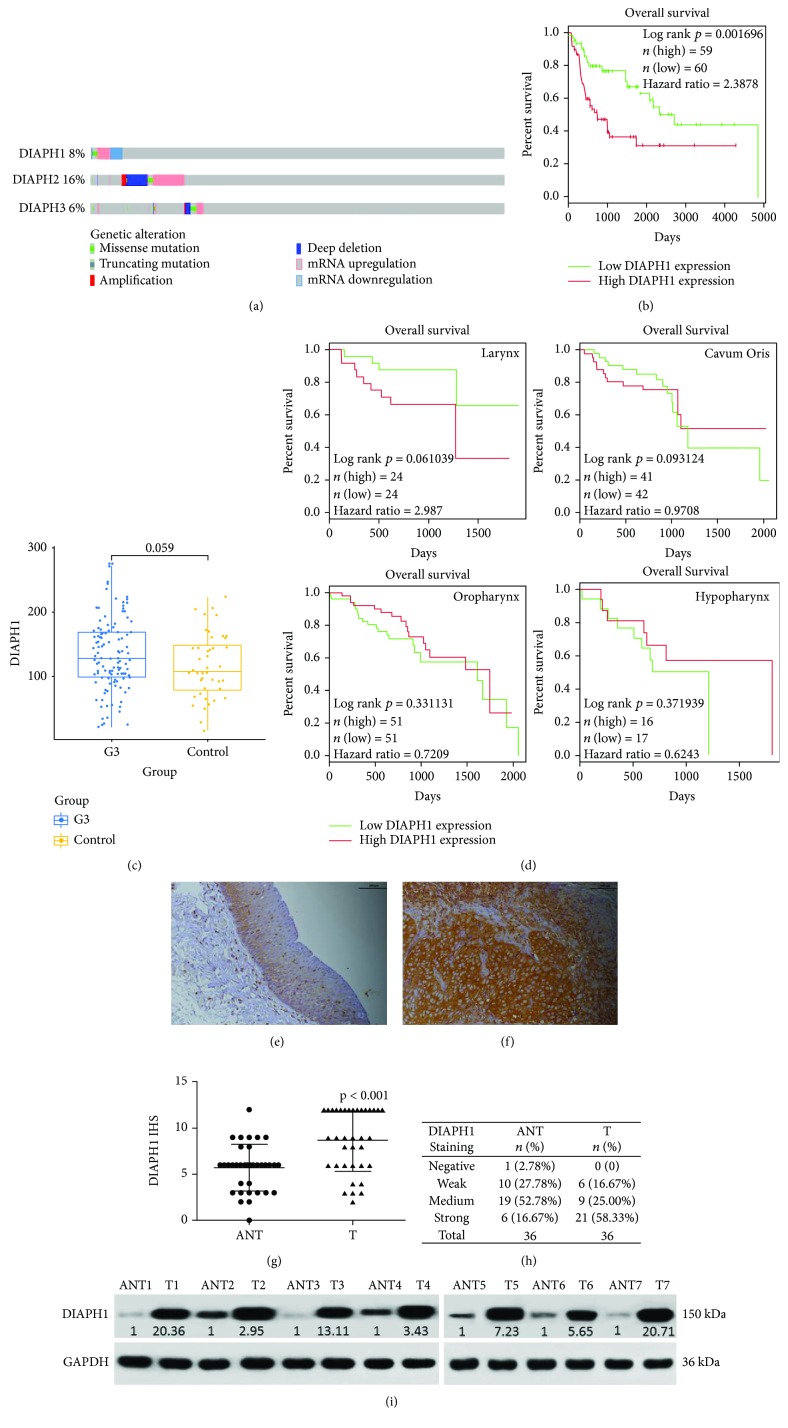
Figure 1.
Bioinformatics and immunohistochemical score (IHS) analysis of DIAPH1. (a) Expression levels of DIAPH1-3 in HNSCC from the TCGA dataset. (b) High expression of DIAPH1 was significantly associated with poor OS in class G3 HNSCC as determined by log-rank test and R platform from TCGA dataset (p = 0.002, hazard ratio = 2.39). (c) DIAPH1 expression was higher in G3 HNSCC tissues than in normal tissues as determined by the Student's t-test from TCGA dataset (p = 0.059). (d) High expression of DIAPH1 was associated with poor OS in LSCC as determined by log-rank test and R platform from GSE65858 dataset (p = 0.061, hazard ratio = 2.99). (e) Weak expression level of DIAPH1 in adjacent nontumor (ANT) tissues (scale bar 100 μm). (f) Strong expression level of DIAPH1 in primary LSCC (T) tissues (scale bar 100 μm). (g) IHS values were calculated using the Mann-Whitney U test. (h) Representative expression of DIAPH1 by IHS in ANT and T tissues. (i) Western blot analysis of DIAPH1 protein expression in seven paired ANT and T tissues.

