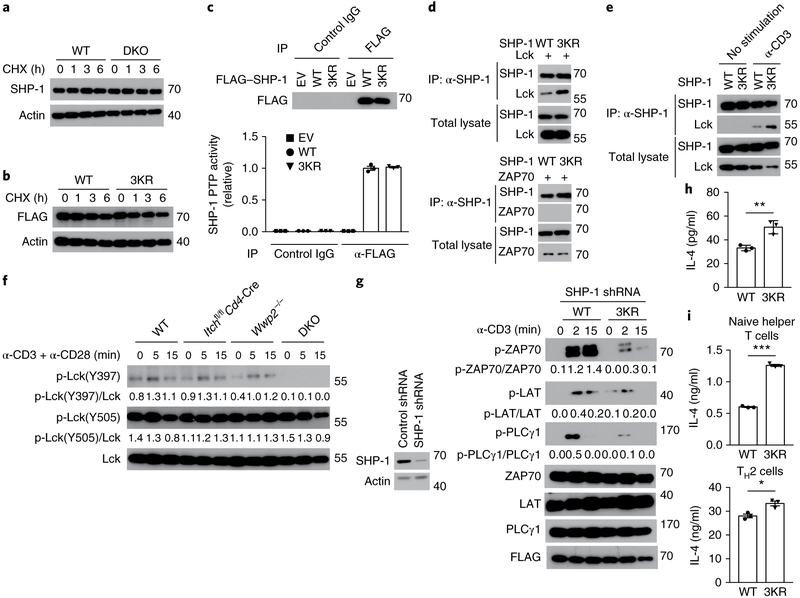
Fig. 7 ∣. SHP-1 ubiquitination regulates the function of Lck.
a, Immunoblot analysis of SHP-1 and actin (loading control) in lysates of wild-type and DKO Jurkat T cells (above blots) treated for 0, 1, 3 or 6 h (above lanes) with 50 μg/ml of cycloheximide (CHX). b, Immunoblot analysis of lysates of Jurkat T cells expressing wild-type SHP-1 or 3KR–SHP-1 (above blots) and treated with cycloheximide as in a. c, Protein tyrosine-phosphatase (PTP) activity of 3KR–SHP-1 among proteins immunoprecipitated, with the control antibody IgG or anti-Flag (below plot), from lysates of Jurkat T cells transfected with empty vector or expression vector for FLAG-tagged wild-type SHP-1 or 3KR–SHP-1 (key), presented relative to the activity of wild-type-SHP-1 (bottom), and immunoblot analysis of such immunoprecipitates (above lanes) (top). d, Immunoblot analysis of the interaction of SHP-1 and Lck in lysates of HEK293T cells transfected with expression vectors for wild-type SHP-1 or 3KR–SHP-1 plus either Lck (top group) or ZAP70 (bottom group) (above lanes), assessed after immunoprecipitation with anti-SHP-1 or without immunoprecipitation (left margin). e, Immunoblot analysis of the interaction of SHP-1 and Lck in Jurkat T cells transfected with expression vectors for wild-type SHP-1 or 3KR–SHP-1 (above lanes) and left unstimulated or stimulated for 5 min with anti-CD3 (above blots), assessed after immunoprecipitation with anti-SHP-1 or without immunoprecipitation (left margin). f, Immunoblot analysis of Lck phosphorylated at Tyr397 (p-Lck(Y397)) or Tyr505 (p-Lck(Y505)) and total Lck in CD4+ T cells sorted from wild-type, Wwp2−/−, Itchf/fCd4-Cre or DKO mice (above blots) and stimulated for 0, 5 or 15 min (above lanes) with anti-CD3 plus anti-CD28; numbers below lanes indicate the ratio of phosphorylated protein to total protein. g, Immunoblot analysis of phosphorylated and total signaling molecules (left margin), and FLAG (loading control), in lysates of Jurkat T cells expressing short hairpin RNA targeting SHP-1 (SHP-1 shRNA) together with FLAG-tagged wild-type SHP-1 or 3KR–SHP-1 (above blots) and stimulated for 0, 2 or 15 min (above lanes) with anti-CD3 (numbers below lanes, as in f) (right blots), and immunoblot analysis of SHP-1 in Jurkat T cells expressing control (non-targeting) or SHP-1-targeting short hairpin RNA (above lanes) (left). h, ELISA of IL-4 in supernatants of GFP+ (transduced) CD4+ T cells sorted from bone marrow chimeras reconstituted with bone marrow cells transduced with retroviral vector encoding green fluorescent protein (GFP) and either wild-type SHP-1 or 3KR–SHP-1 (horizontal access), then stimulated for 48 h with anti-CD3 plus anti-CD28. i, ELISA of IL-4 in supernatants of naive CD4+ T cells transduced to express wild-type SHP-1 or 3KR–SHP-1 (horizontal axis) under neutral conditions (top) or TH2 conditions (bottom) and then allowed to ‘rest’ for 3 d, followed by sorting of GFP+ (transduced) cells and re-stimulation for 24 h with anti-CD3 plus anti-CD28. Each symbol (c,h,i) represents an individual technical replicate (c,i) or mouse (h). *P < 0.05, **P < 0.01 and *** P < 0.001 (unpaired two-tailed Student’s t-test). Data are pooled from or representative of two to three independent experiments (mean ± s.e.m. (c,i) or mean ± s.d. (h) of n = 3 technical replicates).

