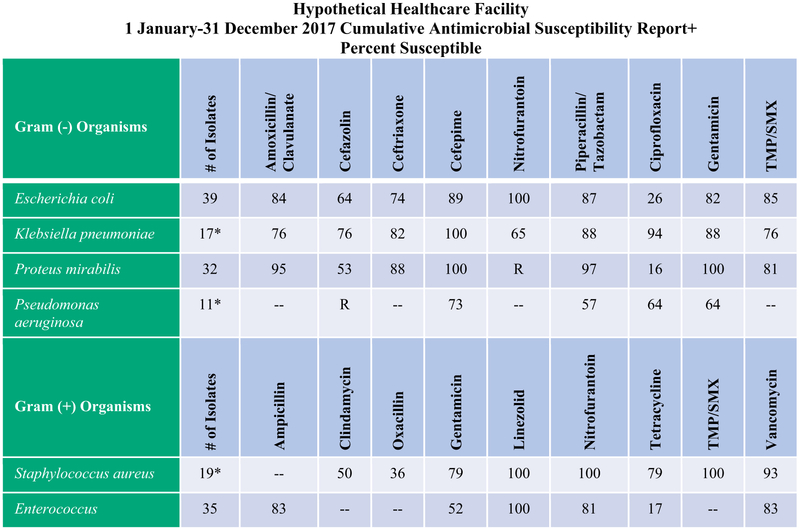
Fig. 1.
Example of hypothetical facility antibiogram with instructions for use.7 Hypothetical healthcare facility 1 January-31 December 2017 cumulative antimicrobial susceptibility report+ percent susceptible; +The percent susceptible for each organism/antimicrobial combination was generated by including the first isolate of that organism encountered on a given patient; *Indicates <30 isolates tested and potentially low accuracy of susceptibility rates; –Indicates the antimicrobial agent is not tested, or is known to be clinically ineffective. R, intrinsic resistance; TMP/SMX Sulfamethoxazole/Trimethoprim. Instructions for Use: (1) Locate the rows that list pathogens that are most likely to cause the infection: (ie, Escherichia coli, Klebsiella pneumoniae, and Proteus mirabilis for a urinary tract infection); (2) Locate columns of antibiotics within the same pathogen rows that have the highest percent susceptible (closest to 100); (3) Identify which antibiotics have the highest percent susceptibility rates, >80%–85% preferred,15,16 and consider these as potential empiric therapeutic options; (4) To support antimicrobial stewardship, choose narrow spectrum agents when possible (eg, TMP/SMX rather than piperacillin/tazobactam).

