
Figure 1.
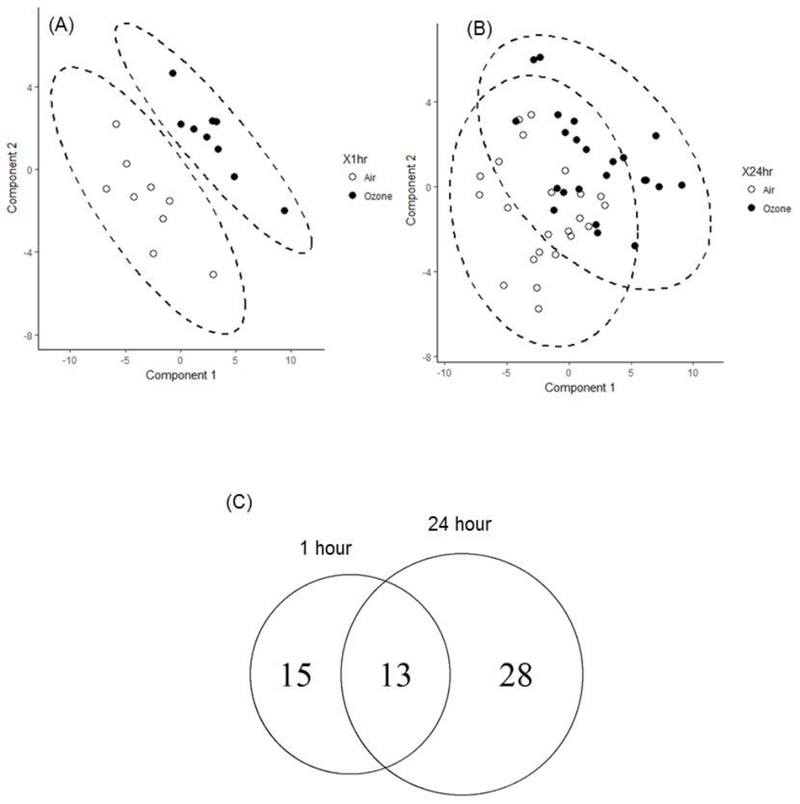
Global metabolomics profiling of human BALF samples after ozone exposure. PLS-DA score plots are calculated from metabolite concentration (A) 1 hour and (B) 24 hour post ozone (●) and clean air (○) exposure with 95 % confidence interval (dashed oval). (C) Venn diagram is plotted for the differentially altered metabolites (p < 0.05) by paired t-test between ozone and air exposure.