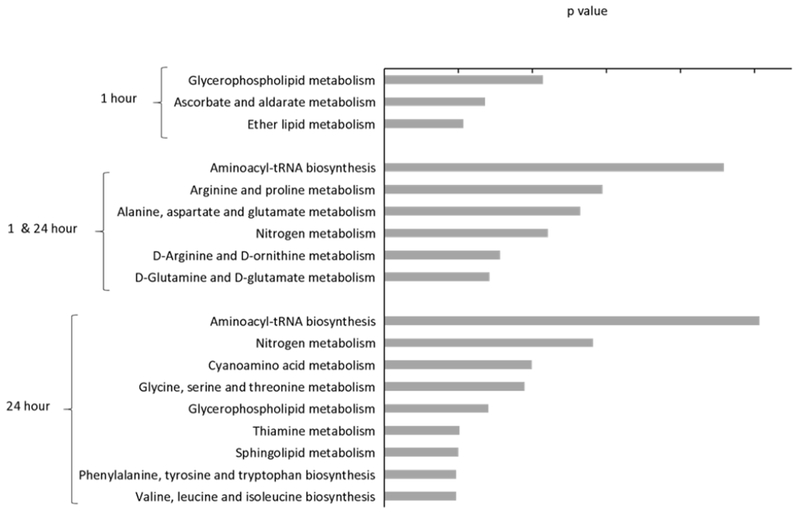
Figure 3.

KEGG pathway analysis of the global metabolite alterations between ozone and air. The metabolites were categorized into 3 groups: 1. Only present in the 1-hour data, 2. Present in both the 1- and 24- hour data and, 3. Present in only the 24-hour data. The significantly altered pathways are ranked plotted by the p-value. The significance level for altered KEGG human pathways was set with p < 0.05 and a false discovery rate q < 0.2.
