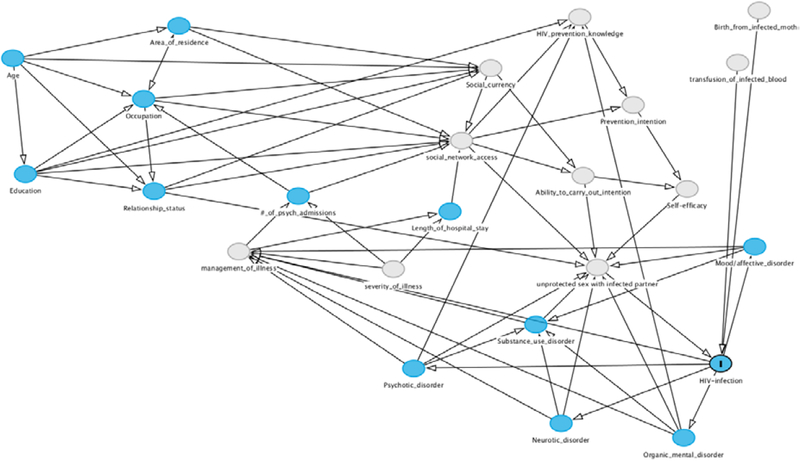
FIGURE 1:
SHES Directed Acyclic Graph (DAG) for HIV-Infection among Psychiatric Inpatients
This DAG depicts the model of cause and effect relationships considered in our statistical analysis. DAGs help guide the appropriate selection of variables to condition on, to control for confounding of exposure variables on the outcome variable HIV-infection.

